The problem The system Proof How we start Fit Free audit
Performance & growth marketing

Your agency reports ROAS.
Your accountant reports reality.

Most agencies are paid to produce dashboards. We are paid to move the number that lands in your bank account. Six disciplines, one loop, run by the partners who do the work.

$24M+ revenue influenced
80+ brands across 4 markets
Every figure is an unedited screenshot
Blended performance · last 12 months
Blended ROAS
4.4x
↑ from 2.0x
Email share
31%
↑ from 4%
Contribution margin
+38%
↑ positive
M1M4M7M10M12
Revenue Ad spend Illustrative composite of live accounts
Open rate
73%
AOV growth
+61%
Categories we have scaled · India, United States, United Kingdom, UAE
The problem

You are spending more than last year and you still cannot tell if it is working.

01
ROAS looks fine. Margin does not.The dashboard is green and the bank balance is flat. Nobody can tell you which of those two numbers is lying.
02
Every vendor sends the report where they won.Media reports on media. Email reports on email. Nobody sends the one report that reconciles to your P&L.
03
Retention is "the email guy".Creative is the agency, media is someone else, and contribution margin is nobody's job. Three vendors, three definitions of revenue.
04
Your best and worst month had the same spend.And no one can explain the gap. So next month's plan is last month's plan with a bigger budget.
You do not have a traffic problem  ·  You do not have a creative problem

You have a problem where nobody owns the profit. Six functions decide your margin, and they report to five different people.

Diagnosis

There are only five places it leaks.

Click a stage to see what it costs. Most brands are losing money in two of them at once, and the audit tells you which two.

The mechanism

Six disciplines. One loop. One P&L.

Split these across four vendors and you get four sets of numbers that never reconcile, because each one is optimising the metric it is graded on and none of them is graded on your profit. We run all six against a single set of unit economics, and we start with the audit rather than the retainer. We also built our own reporting software instead of renting someone else's.

Proof

Four accounts. Unedited screenshots.

Every number on this site is a screenshot from the client's own dashboard, named where the client allows it and anonymised where they do not. Nothing here is redrawn. Tap any dashboard to enlarge.

Jennifer Furniture · United States · named with permission
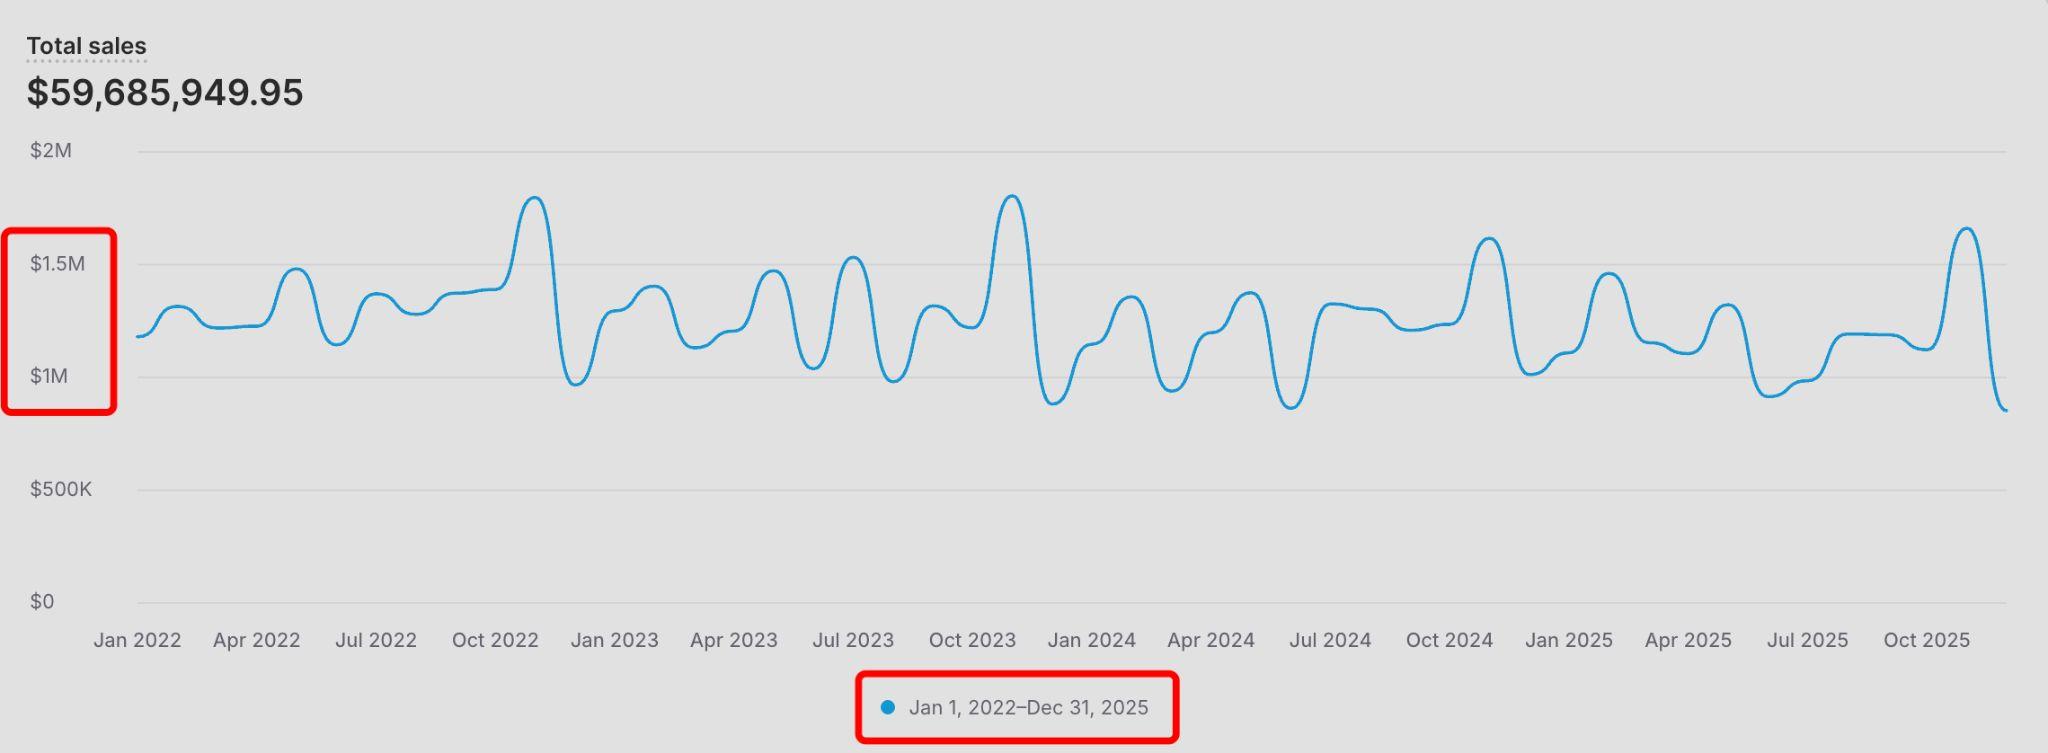
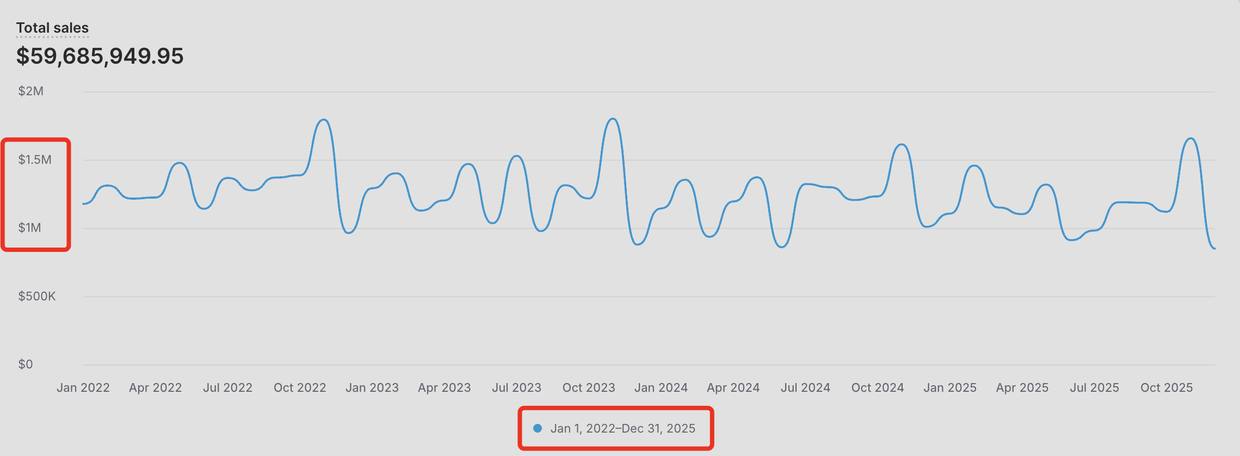
$59.7M in four years

A high-ticket furniture retailer sitting at $2.99M a year. We rebuilt acquisition and stood up a retention program that did not exist, then held a $1M to $1.5M monthly run rate for four straight years. Average order value climbed 61% to $3,039 while volume grew, which is the part most brands get backwards.

See the full breakdown
SHOPIFY :: 2022_TO_2025
Client dashboard export, unedited
Tap to enlarge
$59,685,949.95 total sales, Jan 2022 to Dec 2025
Skincare brand · India · anonymised
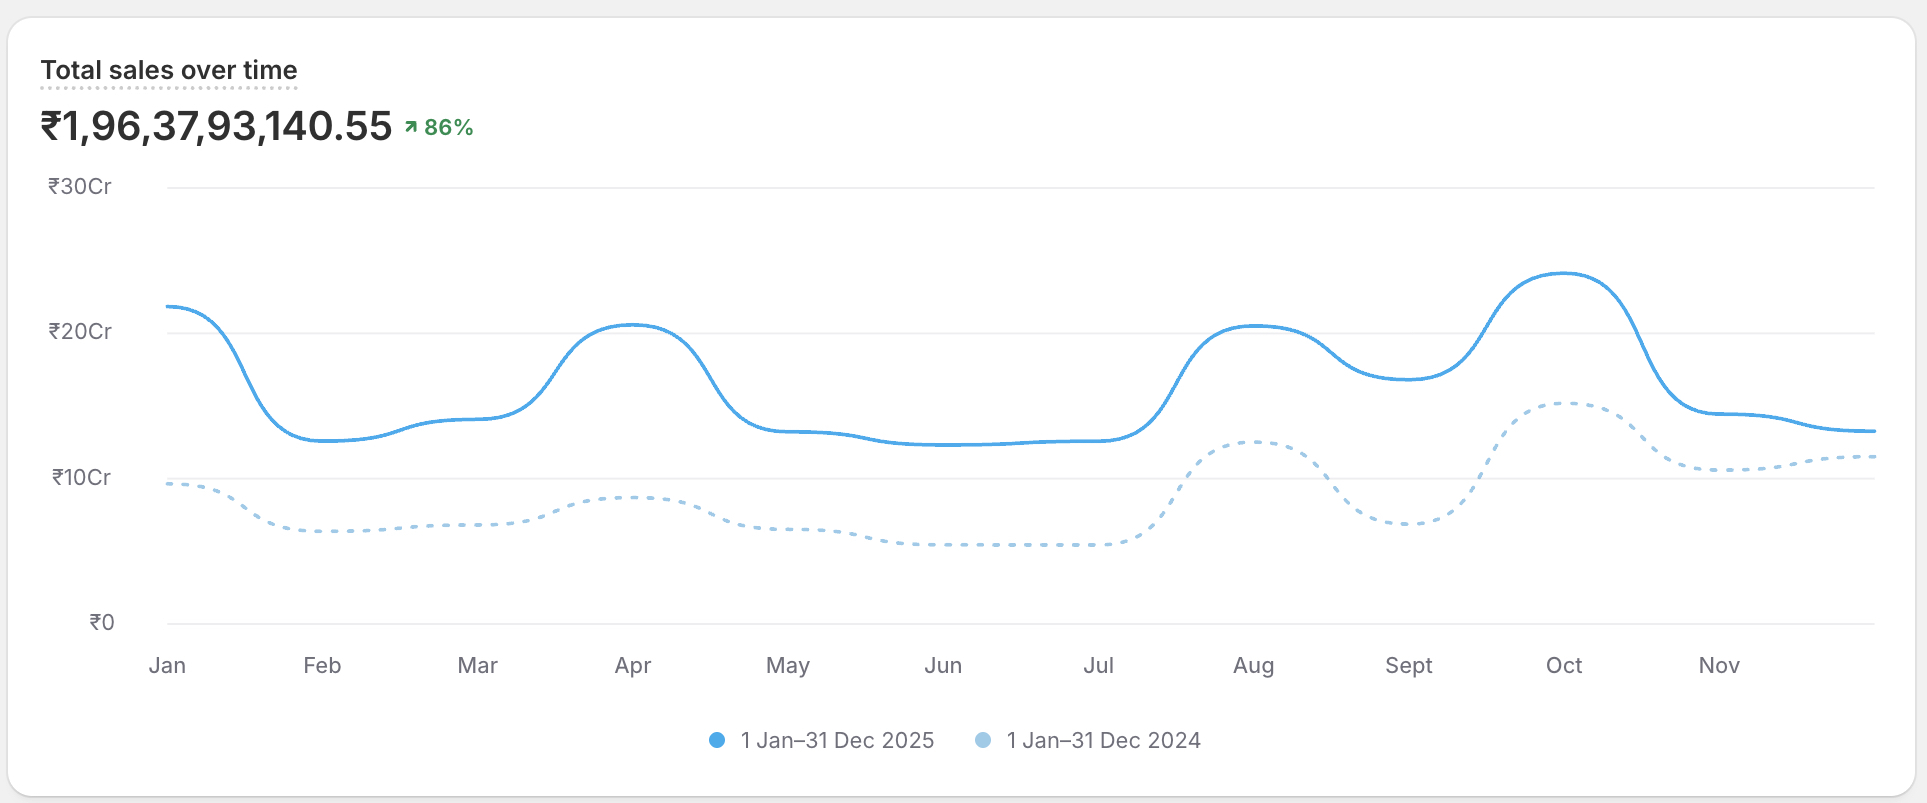
₹196Cr in a single year

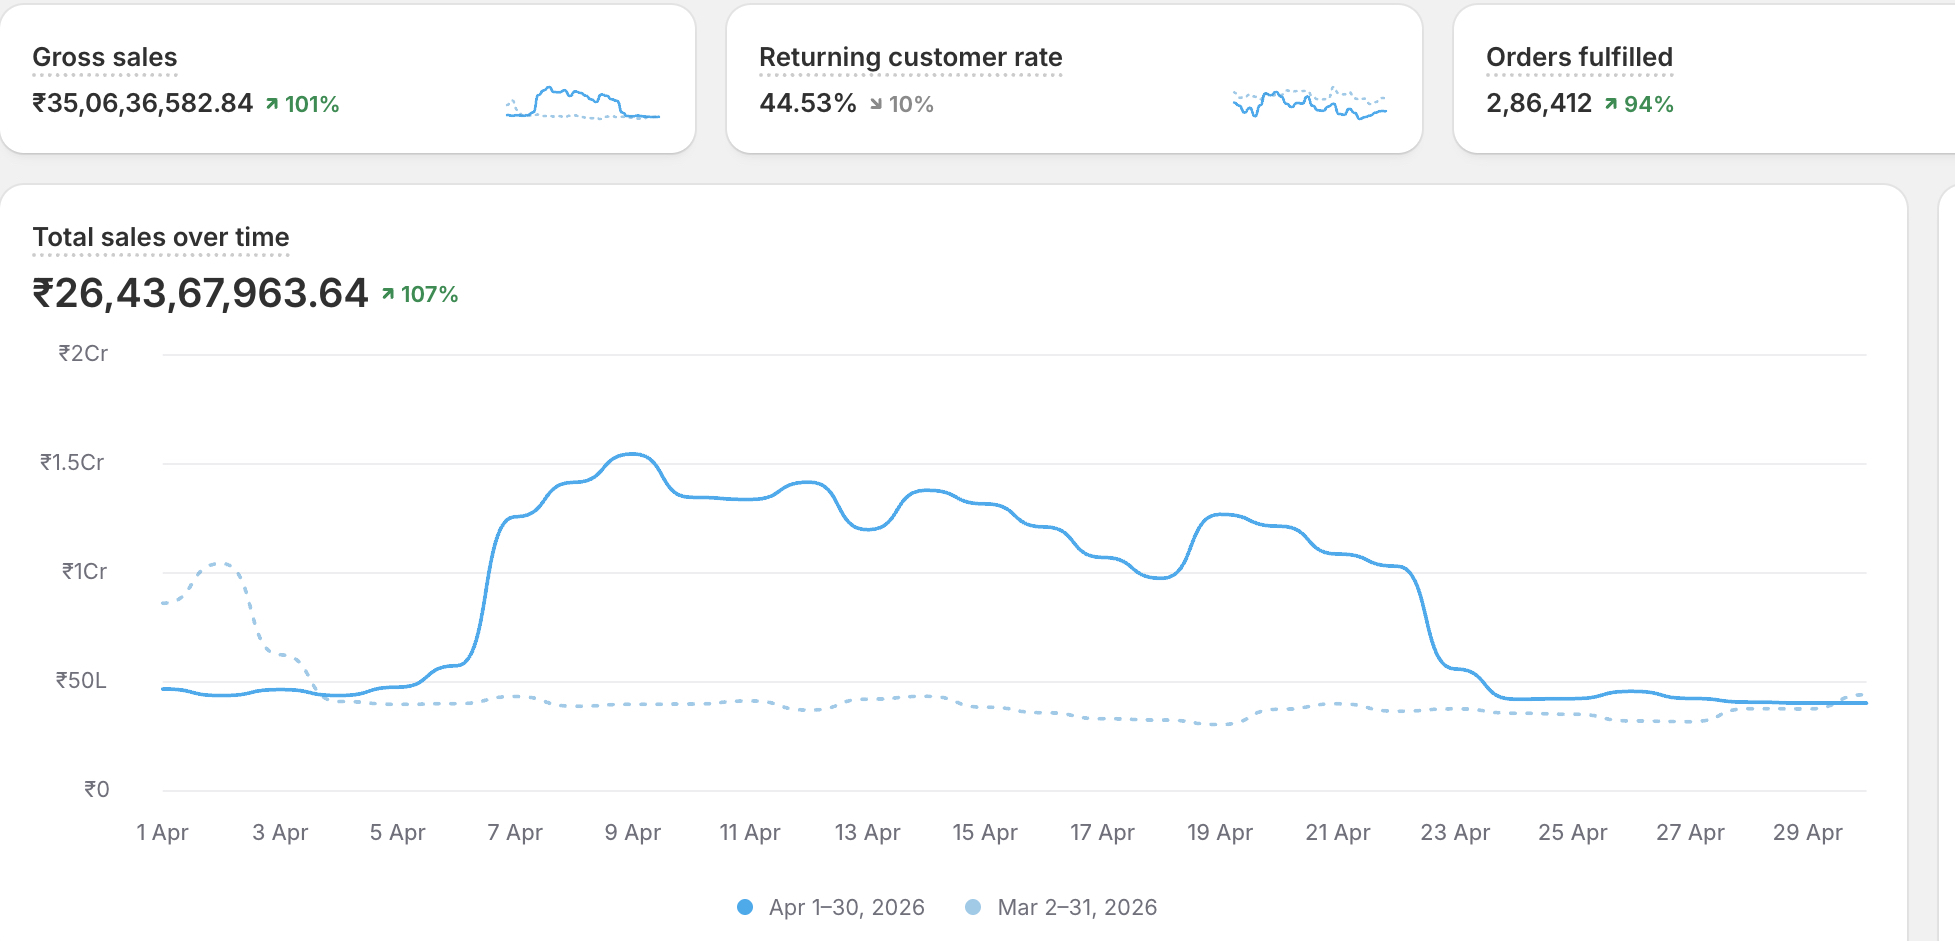
Up 86% year on year, then April 2026 closed at ₹35.06 crore gross, up 101% on the same month last year. 2,86,412 orders fulfilled with a 44.53% returning customer rate, which is what tells you the growth is real and not bought.

See the full breakdown
SHOPIFY :: FULL_YEAR_2025
Client dashboard export, unedited
Tap to enlarge
₹1,96,37,93,140.55 in 2025, up 86%
Food & beverage DTC · India · anonymised
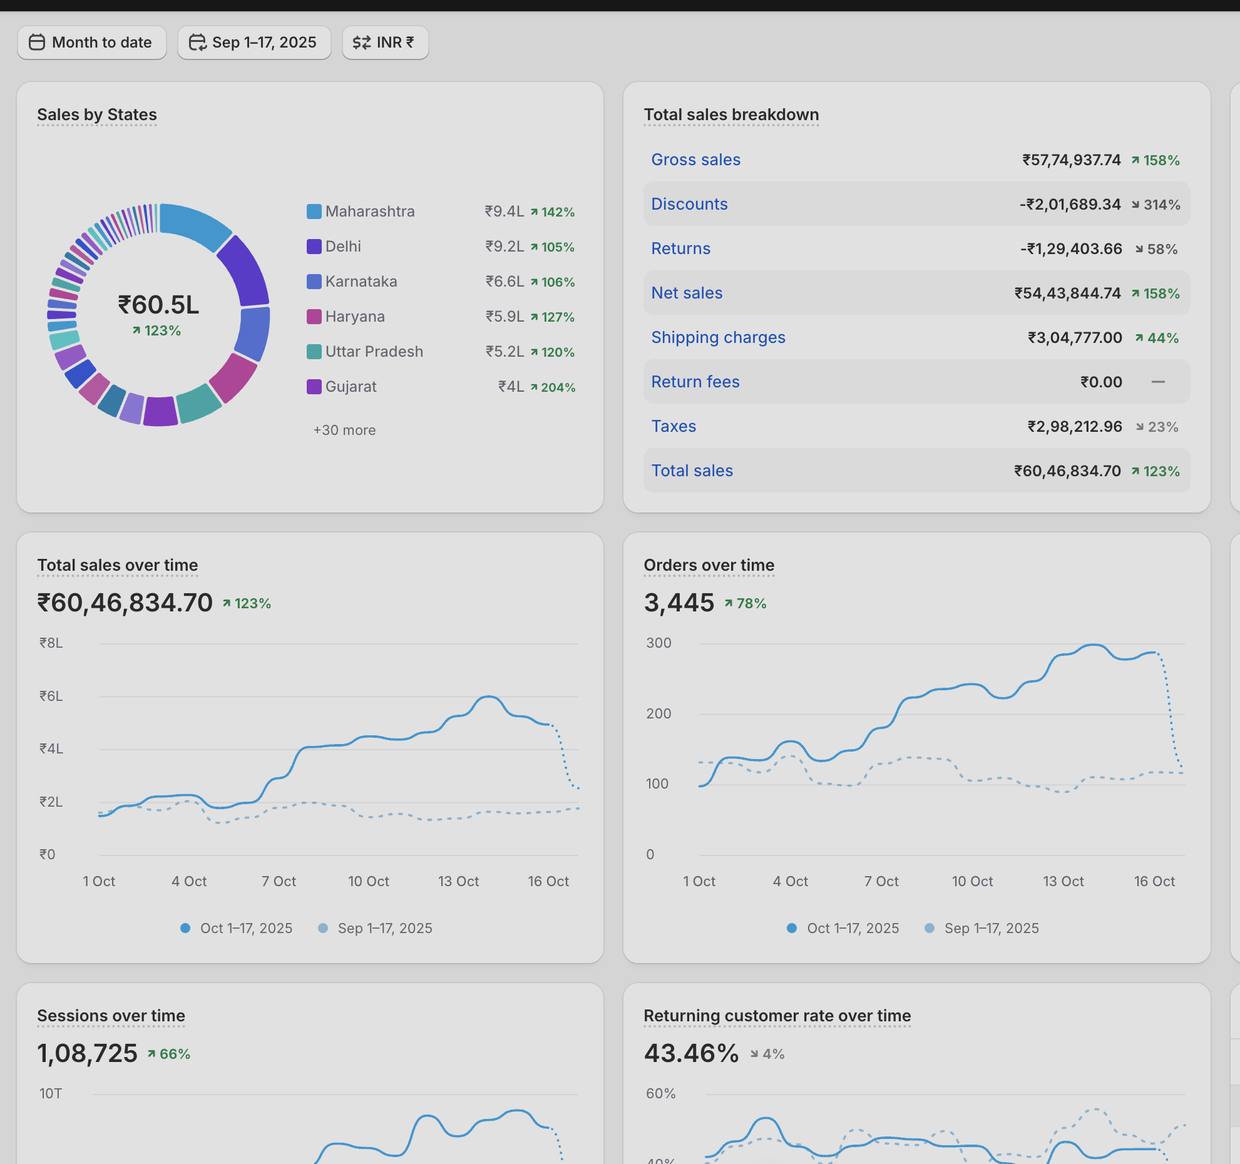
₹60.5L in 17 days

Up 123% on the prior period, with email and SMS built from literally zero to 256.9K and 166.6K subscribers. Automation now out-earns campaigns, so the revenue arrives whether or not anyone sends a newsletter that week.

See the full breakdown
SHOPIFY :: MONTH_TO_DATE
Client dashboard export, unedited
Tap to enlarge
₹60,46,834.70 total sales, up 123%
The Basics Woman · India · named with permission
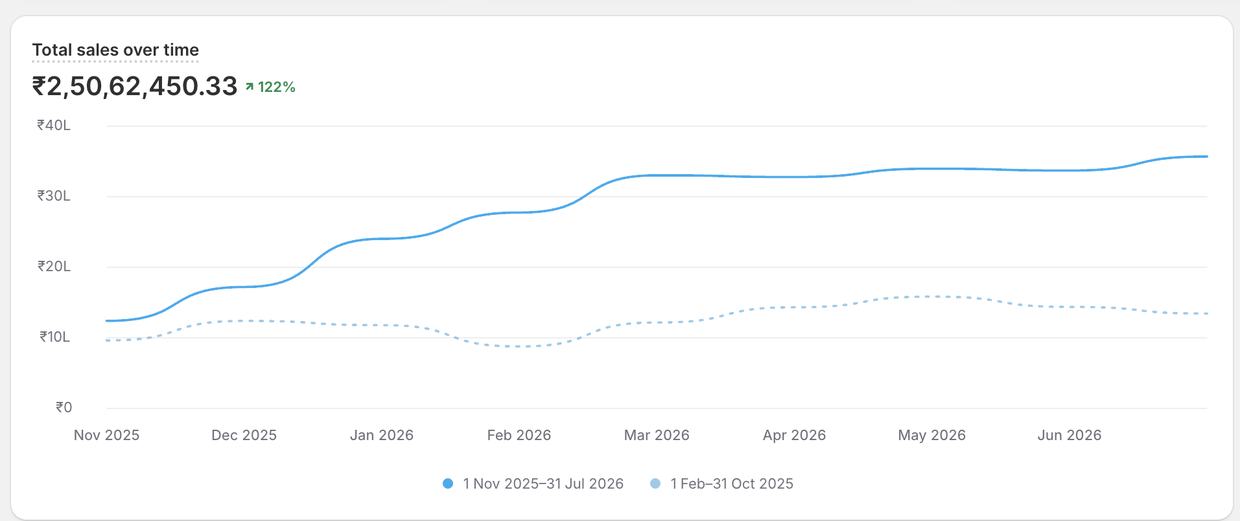
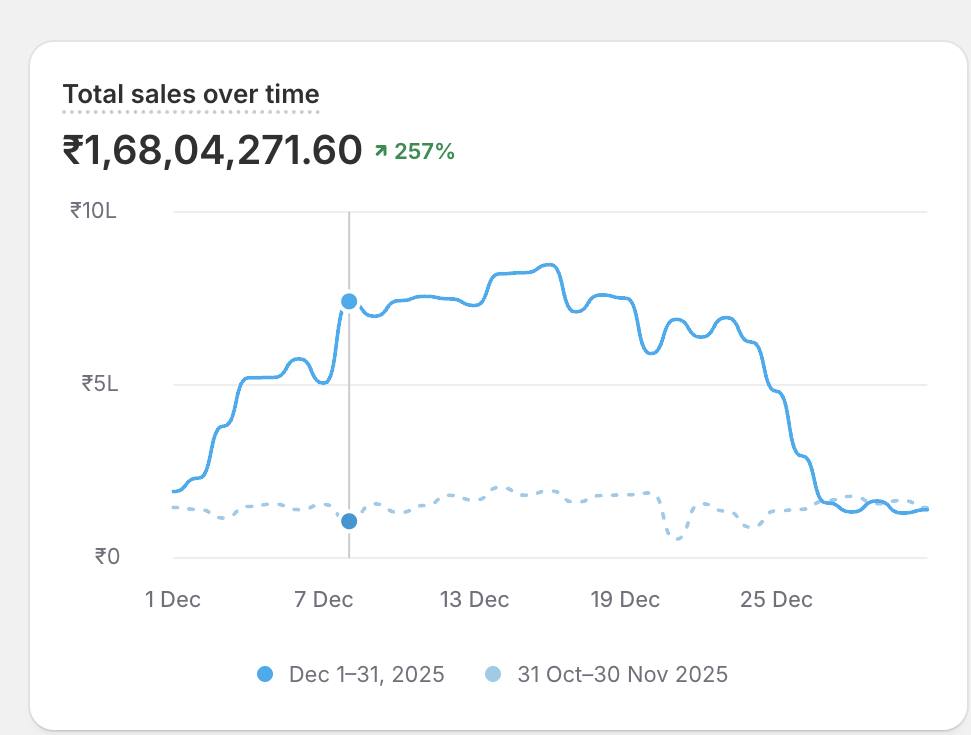
+122% in nine months

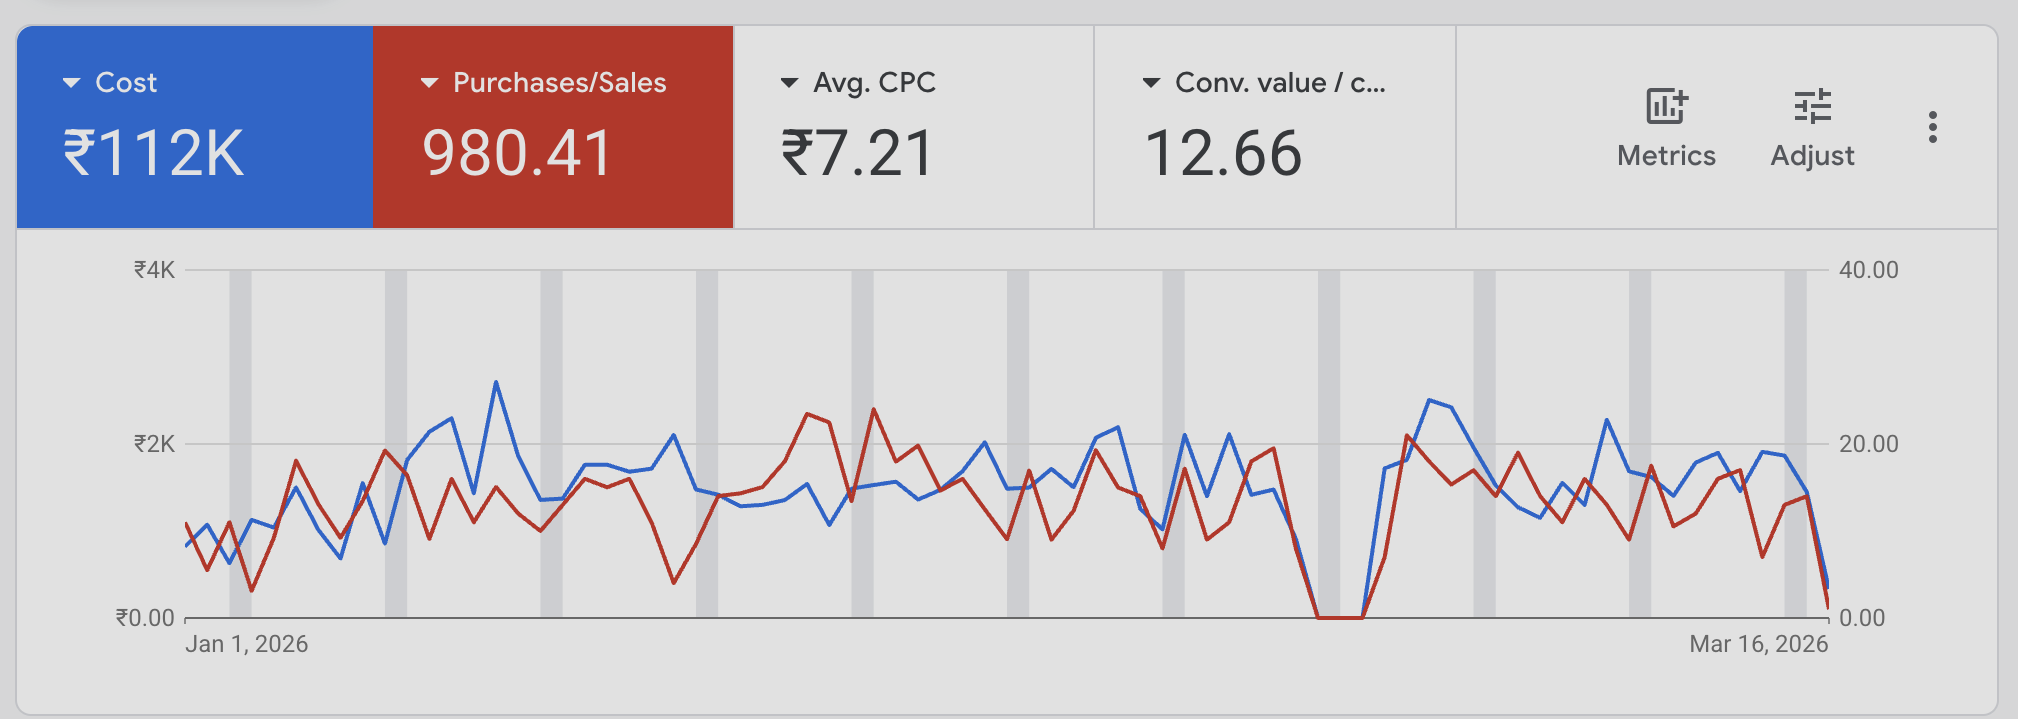
₹2.5 crore in total sales between November 2025 and July 2026, up 122% on the nine months before it. Paid was rebuilt around what the unit economics could carry instead of what the platform recommended, Google Ads alone returned 12.66x in conversion value at a ₹7.21 cost per click, and Amazon went from ₹70K a month to ₹9L in eight months with ad cost of sale down from 60% to 15%.

See the full breakdown
SHOPIFY :: TOTAL_SALES_OVER_TIME
Client dashboard export, unedited
Tap to enlarge
₹2,50,62,450.33 total sales, up 122% period over period
How we start

The audit comes before the invoice.

We would rather diagnose your account than pitch you on one. This is deliberately lower risk than a normal agency pitch: it costs nothing, there is no obligation at the end of it, and the findings are yours to keep even if you never hire us.

01

Free account audit

Paid, retention, funnel and unit economics, written up in about five working days. No cost, no call required first.

02

Ninety-day roadmap

What we fix first, second and third, with the expected impact of each. Yours to keep either way.

03

Measurement before spend

Tracking and blended reporting go live before we touch a budget. You see the baseline we are judged against.

04

Build, then compound

Acquisition and retention on one cadence, reviewed against margin. You own the system, not us.

We did not rent our reporting. We built it.

Metic is our own marketing intelligence software, and it is what we run your account on. Also true about us, not a second thing we are selling you.

About Metic
Who is behind it

You will be talking to the people doing the work.

Essor is partner-led on purpose. There is no account manager relaying your question to someone you have never met, and no junior learning on your budget. Two partners, a specialist team behind them, and a deliberately small number of clients at any one time.

OSOmkar Sangle
Partner · growth & retention

Omkar Sangle

$24M+

Revenue influenced across 50+ brands in ecommerce, DTC and professional services. Builds the retention and analytics side, and built Metic.

AGAshwin Gogawale
Partner · performance & media

Ashwin Gogawale

₹87Cr+

Revenue influenced across 60+ brands, including enterprise paid social at ₹5-7Cr monthly budgets inside a global agency. Runs acquisition and media.

Fit

We take on a small number of engagements at a time.

Which means we would rather tell you now if this is not a match than find out in month three. Read both lists honestly.

This is probably a fit if
  • You are doing $25K a month or more in revenue and already spending on paid media, retention or CRO.
  • You suspect the reporting you get is flattering, and you want someone to check.
  • You can give one team authority over acquisition, retention and measurement together.
  • You care about contribution margin, not just ROAS, and you know the difference.
  • You want partners who will tell you when a channel is not worth the spend.
This probably is not a fit if
  • ×You want the cheapest agency in the room. Retainers start at $2,100 a month and we do not discount to win the work.
  • ×You need a button-pusher who executes without questioning the strategy.
  • ×Your product has no repeat purchase and no margin to work with. Retention cannot fix arithmetic.
  • ×You want a guaranteed ROAS number on the first call. Anyone who gives you one is guessing.
  • ×You need thirty people on the account. We are deliberately small and we intend to stay that way.
The next step

Find the leak before
you spend again
.

A written audit of your acquisition, retention and conversion setup. No cost, no obligation, findings are yours to keep.

  • Returned in about five working days
  • Ranked by revenue at stake, not by what we sell
  • Run on Metic, so you see the same data we do
Or omkar@essorpartnersllp.com
Goes straight to Omkar. Usually answered same day.
Services

Six disciplines that only work together.

You can hire five specialists and spend your week translating between them. Or you can hire one team that treats acquisition, retention, marketplaces, conversion, creative and measurement as a single P&L.

Paid media & acquisition

Meta and Google structured for lifetime value rather than last click. Catalog and feed architecture, disciplined creative testing, and budget liquidity across platforms so no single channel holds you hostage.

4.9x
Meta ROAS
3.72x
Google ROAS on $2.5M
Meta adsGoogle searchShoppingPMaxCatalogAmazonFlipkartTikTok

Lifecycle & retention

Klaviyo and Omnisend builds from scratch, or rescues of accounts that were never set up properly. Deliverability first, then flows, then segmentation, then a campaign cadence that does not burn the list.

4% → 31%
Email share of revenue
60-84%
Open rates achieved
KlaviyoOmnisendRebengageSMSWhatsAppRFM cohortsDeliverabilityWin-back

Analytics & unit economics

The layer most agencies quietly skip. Server-side tracking, blended reporting, CAC payback periods and contribution margin models that tell you whether any of the work above is actually earning money.

₹1.61Cr
Sales lifted in 7 months
5-8%
Dilution saved on a raise
GA4Meta CAPIGTMLooker StudioMixpanelCM3LTV / CAC cohorts

Web, CRO & SEO

Storefronts, landing pages and full builds, plus technical and content SEO, and the conversion work that follows. Leak analysis across the whole path from ad click to order confirmation, with product page, popup and checkout changes tested rather than debated. This is where we start when the traffic is fine and the site is the bottleneck, which happens more often than founders expect.

+61%
AOV growth after CRO
7,400
Item feed rebuilt
ShopifyWordPressLanding pagesA/B testingCheckout & AOVTechnical SEOContentCore Web Vitals

Graphics, video & motion

Creative is the biggest lever in paid media and the one most agencies outsource badly. Ours is in-house: static ad creative, motion graphics, video editing and brand identity work, produced fast enough to keep a weekly testing cadence rather than a monthly one.

7+ yrs
Creative lead experience
3-5 day
Concept to live asset
Static ad creativeMotion graphicsVideo editingUGC editsBrand identityWebsite visualsCatalog imagery

Marketplaces & quick commerce

Your own store is one shelf. Amazon, Walmart and eBay are where the ready-to-buy searches already happen, and in India quick commerce is where the repeat order goes. Listings and A+ content, feed hygiene, sponsored products and brands, and the ad cost of sale that decides whether the channel is profitable.

₹70K → ₹9L
Monthly Amazon revenue, 8 months
60% → 15%
Ad cost of sale
Amazon AdsWalmart MarketplaceeBayBlinkitZeptoInstamartListings & A+Feed hygieneACOS & TACOS

Not sure which one you need?

That is what the audit is for. We look at all six and tell you which one is costing you the most money right now, ranked, with the expected impact of fixing each.

Engagement model

How the work is structured.

Growth retainer

Monthly, partner-led, covering the disciplines your audit flagged. Fixed cadence, documented decisions, one blended reporting view.

Setup & rebuild

One-off infrastructure work where nothing usable exists yet. Tracking, lifecycle build, feed architecture, or a site rebuild.

Diagnostic audit

The free entry point. Written findings, ranked priorities, ninety-day roadmap. Yours to keep whether or not you work with us.

Case studies

The work, with the numbers attached.

Every metric on this page is screenshot-verified from a platform dashboard. Four clients are named with their permission; the rest are described by category and market, because those agreements do not allow naming.

SHOPIFY :: TOTAL_SALES 2022-2025
Client platform export, unedited
Swipe to pan the full dashboard
Client platform export, unedited
United States · Furniture DTC

Jennifer Furniture

Head of Growth and Retention on a $15M-a-year the US furniture retailer Jennifer Furniture, leading a 42-member team. Built the entire email channel from near-zero and rebuilt a 7,400-item catalog feed.

$180K+
Monthly email revenue
6.1x
Meta ROAS on $92K spend
20% → 73%
Average open rate
  • RevenueEmail went from 4% to 31% of total revenue in 90 days, after a 90-day performance deal turned into the Head of Growth role.
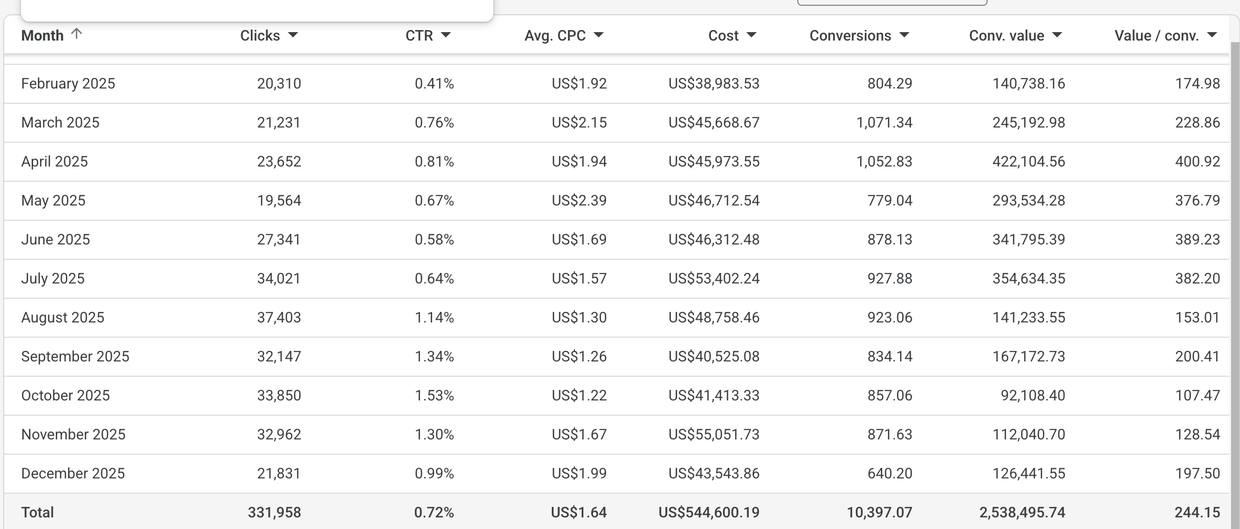
  • Paid$544K of Google Ads spend produced $2.54M in conversion value in 2025, a 4.66x return, with 60% of budget running through catalog ads.
  • Peak$286K in single-day Black Friday revenue. Average order value grew 61%, from $2,151 to $3,039.
SHOPIFY :: TOTAL_SALES_OVER_TIME
Client platform export, unedited
Swipe to pan the full dashboard
Client platform export, unedited
India · Women's health

The Basics Woman

A women's hormone health and supplements brand stuck at rupees 12 lakh a month on a 2x blended ROAS, with a fundraise about to be raised on a model that did not hold up.

3x
Revenue growth in 4 months
2x → 4.4x
Blended ROAS, same spend
₹2.5Cr
Sales in 9 months, +122%
  • MarginUnit economics moved from loss-making to consistently profitable in four months, with purchase frequency at 1.7-2.1x and LTV to CAC at 5x on ads.
  • DiscoveryGoogle Ads was running at 12x ROAS on 5.8% of total budget. Nobody had looked. We rebuilt the channel mix around it.
  • MarketplaceAmazon scaled from ₹70K to ₹9L a month in eight months, with ad cost of sale cut from 60% to 15% over the same period.
  • EquityCorrecting the financial model before the raise saved an estimated 5-8% dilution.
OMNISEND :: SALES_PERFORMANCE
Client platform export, unedited
Swipe to pan the full dashboard
Client platform export, unedited
India · Sneakers

Sneaker brand, India

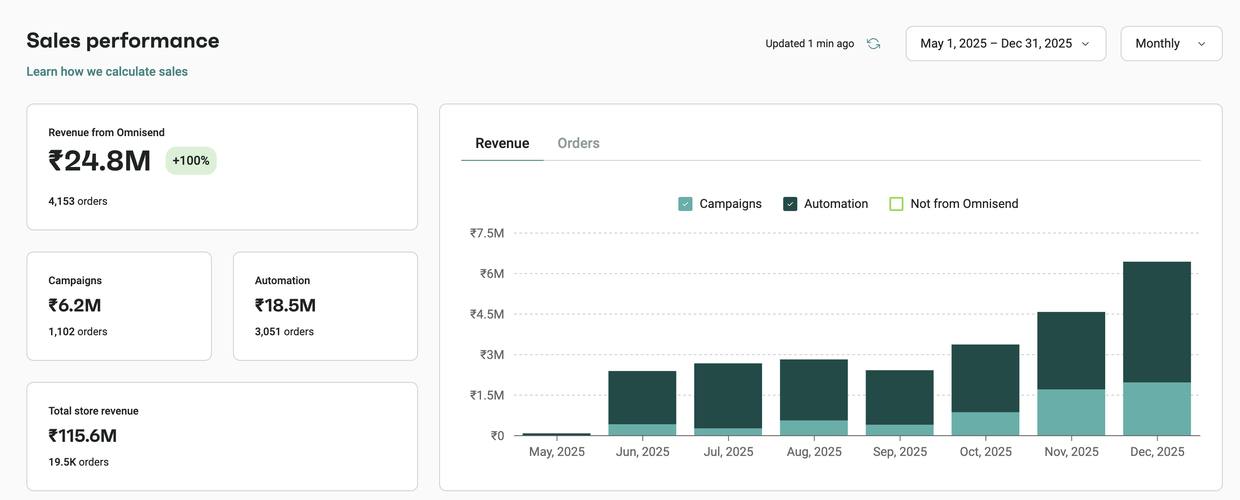
A rupees 115.6 million sneaker brand with no retention infrastructure at all. No list, no SMS, no automation, and no way to reach a customer twice without paying for the click again.

₹24.8M
Email revenue, +100% YoY
256.9K
Email subscribers built
166.6K
SMS subscribers built
  • Automation75% of email revenue now comes from automated flows rather than manual campaign sends.
  • EngagementCampaign open rates held between 47% and 64% on sends of 30,000-plus.
  • ShareRupees 24.8 million of a 115.6 million store, built inside eight months.
KLAVIYO :: CONVERSION_SUMMARY
Client platform export, unedited
Swipe to pan the full dashboard
Client platform export, unedited
India · Supplements

Supplement brand, India

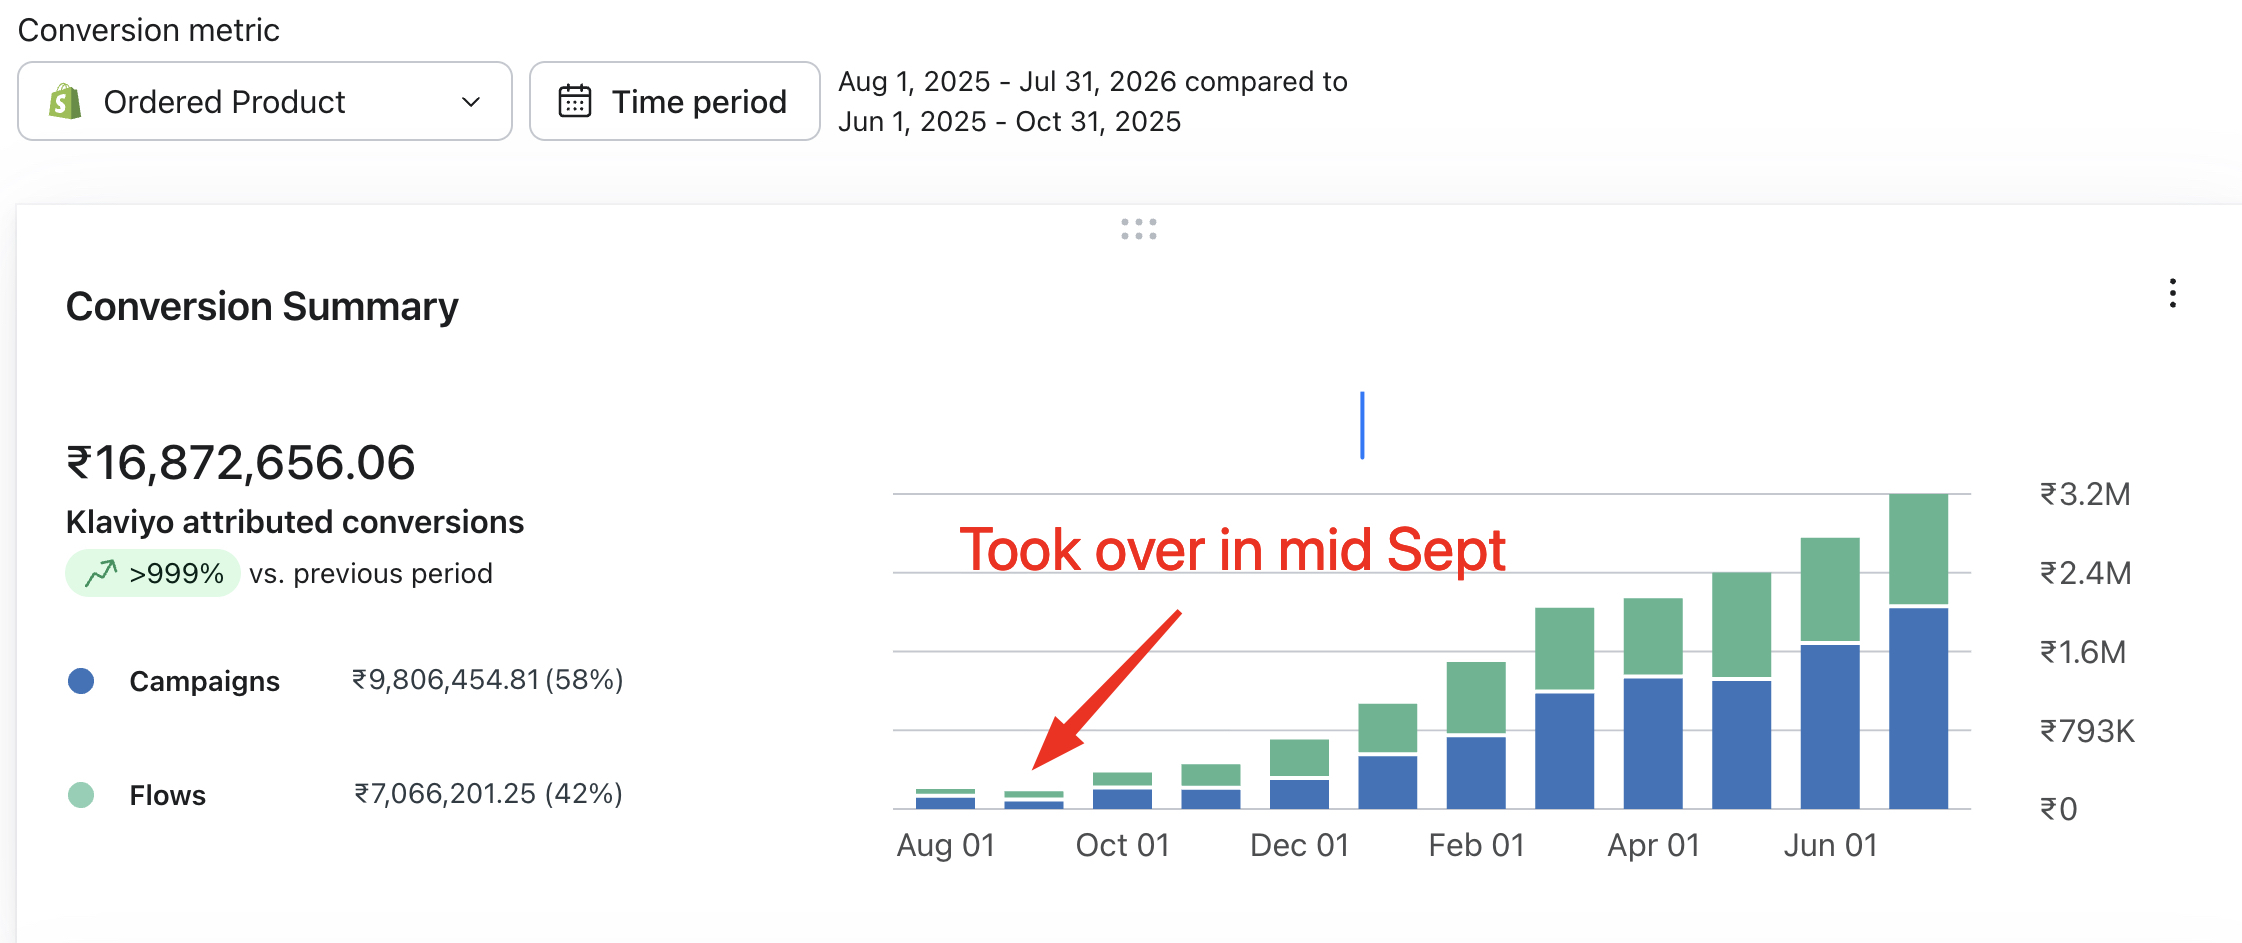
Thirty-nine flows live, five of them draft flows quietly sending to real customers. Open rates stuck at 16%, deliverability damaged, email contributing almost nothing. We took the account over in mid-September 2025.

₹1.69Cr
Email revenue in 12 months
16% → 60%
Open rate in 2 months
42%
Of email revenue from flows
  • FixedFive draft flows were found sending to live customers and stopped inside the first week.
  • HygieneDeliverability recovered through a sending subdomain warm-up and a list hygiene programme.
  • StructureThirty-nine unmanaged flows consolidated into one documented lifecycle system.
  • CompoundingMonthly attributed revenue climbed from near-zero at takeover to over rupees 32 lakh, campaigns 58% and flows 42%.
SHOPIFY :: DECEMBER_REVENUE
Client platform export, unedited
Swipe to pan the full dashboard
Client platform export, unedited
India · Food DTC

Food DTC brand, India

A bakery and food brand on WooCommerce with no email programme and open rates at 8%. WooCommerce makes lifecycle work harder than Shopify, which is usually why nobody has bothered.

25x
Email revenue in 6 months
8% → 45%+
Open rate
₹10K → ₹2.64L
Monthly email revenue
  • PlatformBuilt entirely on WooCommerce, where most lifecycle tooling quietly assumes Shopify.
  • ApproachDeliverability and sender reputation were established before a single campaign went out.
KLAVIYO :: EMAIL REVENUE23x in 2 months
2.5L 1.2L 0 MAY JUN JUL ₹11.1K ₹2.53L
Klaviyo attributed revenue, same store, no change in ad spend level
India · Home decor

Artisanal home decor brand, India

A Shopify store carrying its entire revenue on paid media. Email had four basic flows, a largely dormant list and was contributing about ₹11K a month. Paid and retention were run by different people who never saw each other's numbers.

23x
Email revenue in 2 months
3.79x
Blended ROAS, Meta + Google
+65%
Active email audience
  • RetentionFour basic flows became a full lifecycle system. Email went from ₹11.1K to ₹2.53L a month, with the abandoned checkout flow alone becoming the single largest automated earner.
  • PaidMeta and Google were rebuilt and reported together, landing a blended 3.79x on a ₹23.1L revenue month.
  • ListActive audience grew 65% through on-site capture and reactivation, not bought lists, so deliverability held while volume climbed.
META ADS MANAGER :: LEADS_BY_ADSET
Client platform export, unedited
Swipe to pan the full dashboard
Client platform export, unedited
United States · Legal services

Benemerito Attorneys at Law

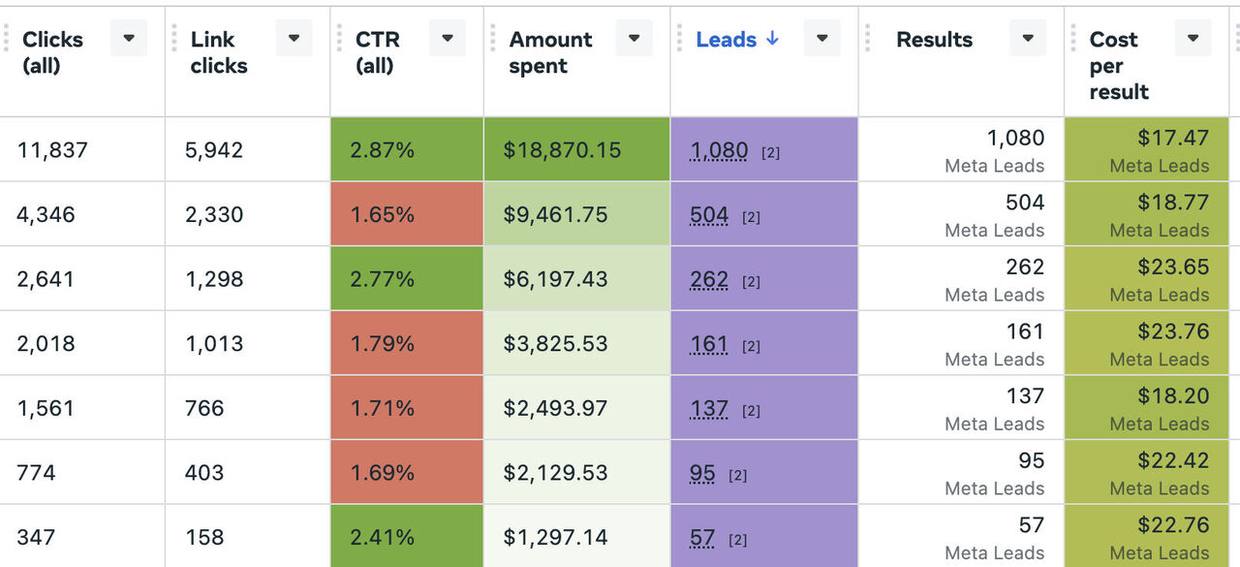
A New York boutique law firm in startup capital formation needed consistent lead flow in one of the most expensive verticals in paid media, where cost per lead routinely runs into three figures.

1,760
Leads via Meta Ads
$18.85
Cost per lead
2.88%
Peak CTR on $33.2K
  • EfficiencySustained sub-$20 cost per lead in a vertical where $80-150 is the norm.
  • TrackingServer-side conversion tracking rebuilt so lead quality, not lead volume, drove optimisation.
  • SystemsA nine-stage pipeline with eleven automated workflows, documented and handed over.
Named with permission
Jennifer FurnitureThe Basics WomanBenemerito Attorneys at LawNextGen Technologies

Remaining engagements are described by category and market, since those agreements do not permit naming.

Showing 7 of 7 engagements

Raw reporting

Pulled straight from the platforms.

Every number on this site comes from a client dashboard we had login access to. Below are the exports themselves, cropped only to remove account names where an agreement requires it.

KLAVIYO :: CONVERSION_SUMMARY
Client platform export, unedited
Swipe to pan the full dashboard
Client platform export, unedited
Jennifer Furniture · United States

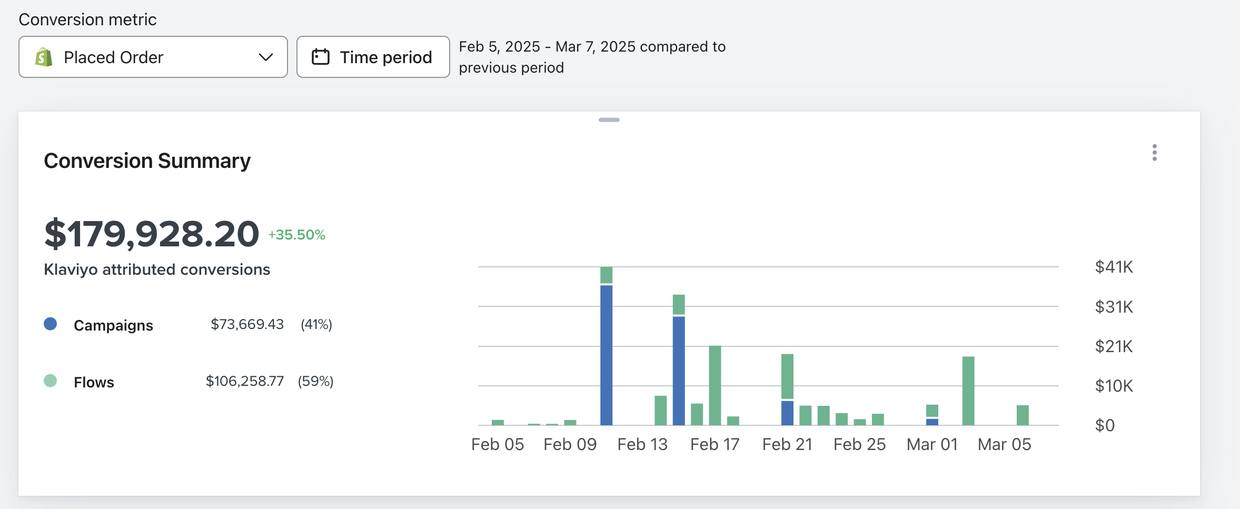
$179,928 in a single 30-day window

Attributed email revenue, up 35.5% period on period, with flows carrying 59% of it. That split is the whole point: the revenue keeps arriving whether or not anyone sends a campaign that week.

GOOGLE ADS :: MONTH_ON_MONTH
Client platform export, unedited
Swipe to pan the full dashboard
Client platform export, unedited
Jennifer Furniture · United States

$544.6K spend, $2.54M conversion value

Eleven months of Google Ads at a roughly $244 value per conversion, on a catalog of 7,400 items rebuilt at the feed level before any budget moved.

INTERNAL :: PURCHASE_FREQUENCY
Margin and LTV rows removed
Swipe to pan the full dashboard
Margin and LTV rows removed
The Basics Woman · India

Repeat purchase rate, tracked monthly

The unit economics model we run every month, not the ad dashboard. Returning customers buy 3.2 to 3.9 times against 1.0 to 1.3 for new ones, which is the number that decides whether paid spend is affordable. Margin and LTV rows are held back at the client's request.

SHOPIFY :: MONTH_TO_DATE
Client platform export, unedited
Swipe to pan the full dashboard
Client platform export, unedited
Food and beverage DTC · India

₹60.5L in 17 days, up 123%

Orders up 78% and a 43% returning customer rate. Retention doing the heavy lifting on a category where most brands buy the same customer twice.

OMNISEND :: AUDIENCE_GROWTH
Client platform export, unedited
Swipe to pan the full dashboard
Client platform export, unedited
Sneaker brand · India

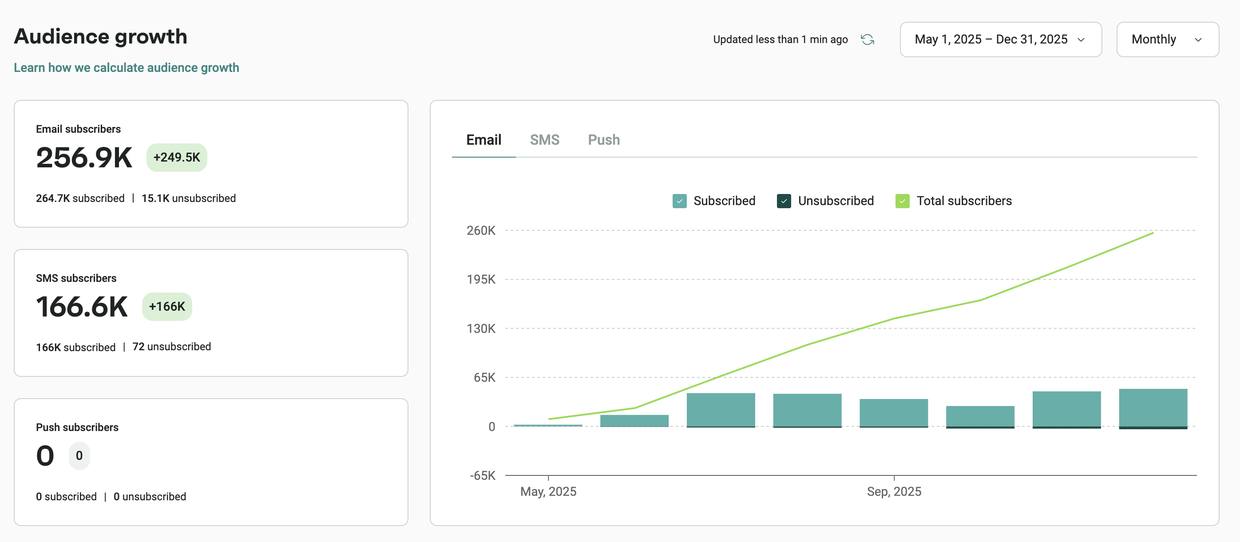
256.9K email and 166.6K SMS, from zero

Eight months of owned-audience building on a brand that previously had no way to reach a customer a second time without paying for the click again.

KLAVIYO :: FLOW_PERFORMANCE
Client platform export, unedited
Swipe to pan the full dashboard
Client platform export, unedited
Wellness brand · India

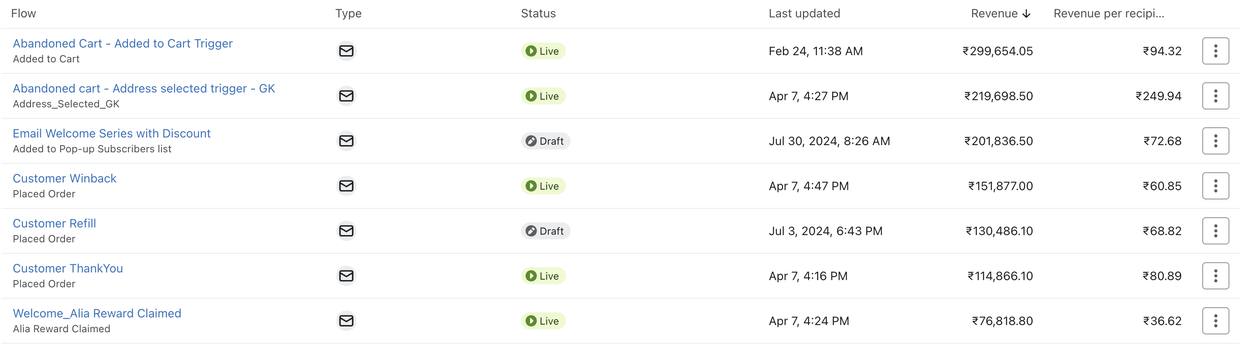
₹249.94 revenue per recipient on the best flow

Seven live flows carrying the retention engine. The highest earner returned ₹2.99L on its own, and the strongest performer per recipient returned ₹249.94 from a single address-selected abandoned cart trigger. This is what an always-on automation layer looks like once it is actually built.

Other results

More of the same, from other accounts.

Further exports from accounts we and our team have run. Four clients are named with their permission, the rest are shown by category because their agreements do not allow it. Same rule as everywhere else on this site: nothing is redrawn, these are the dashboards themselves.

SHOPIFY :: 2022_TO_2025
Client platform export, unedited
Swipe to pan the full dashboard
Client platform export, unedited
Jennifer Furniture · United States

$59.7M in total sales across four years

January 2022 to December 2025 on one store, holding a $1M to $1.5M monthly run rate the whole way. High-ticket furniture rewards predictability far more than spikes, and this is what a system looks like when it is left to compound.

SHOPIFY :: FULL_YEAR_2025
Client platform export, unedited
Swipe to pan the full dashboard
Client platform export, unedited
Jennifer Furniture · United States

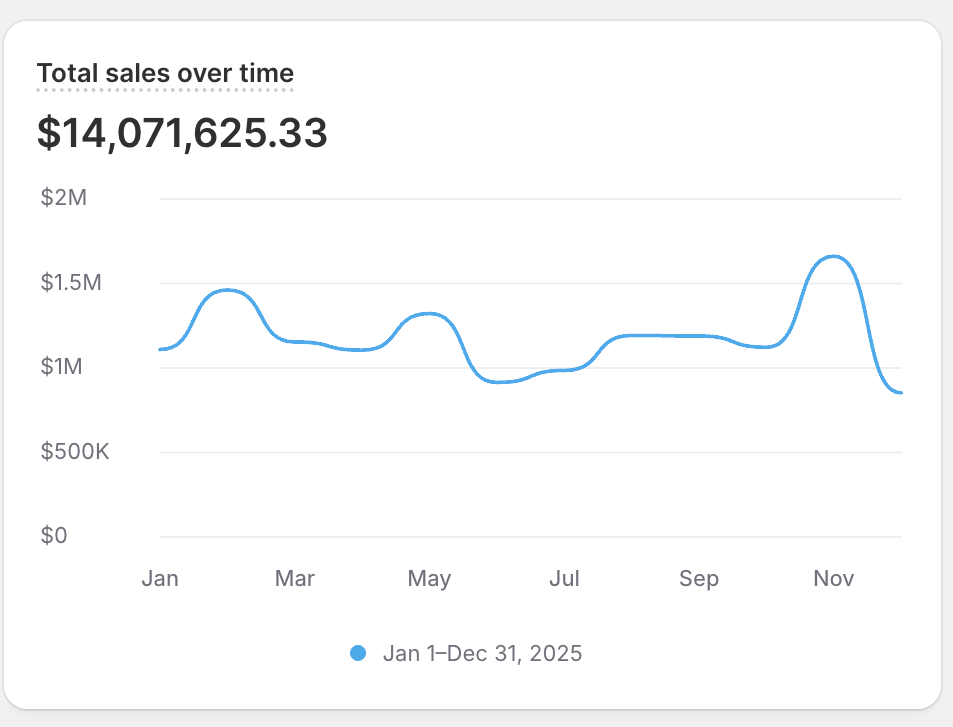
$14.07M in 2025, from $2.99M in 2021

Same store, four years apart. 2023 closed at $15.29M and 2024 at $14.58M, so the business now sits at a stable multiple of where it started rather than riding one good year.

SHOPIFY :: AVERAGE_ORDER_VALUE
Client platform export, unedited
Swipe to pan the full dashboard
Client platform export, unedited
Jennifer Furniture · United States

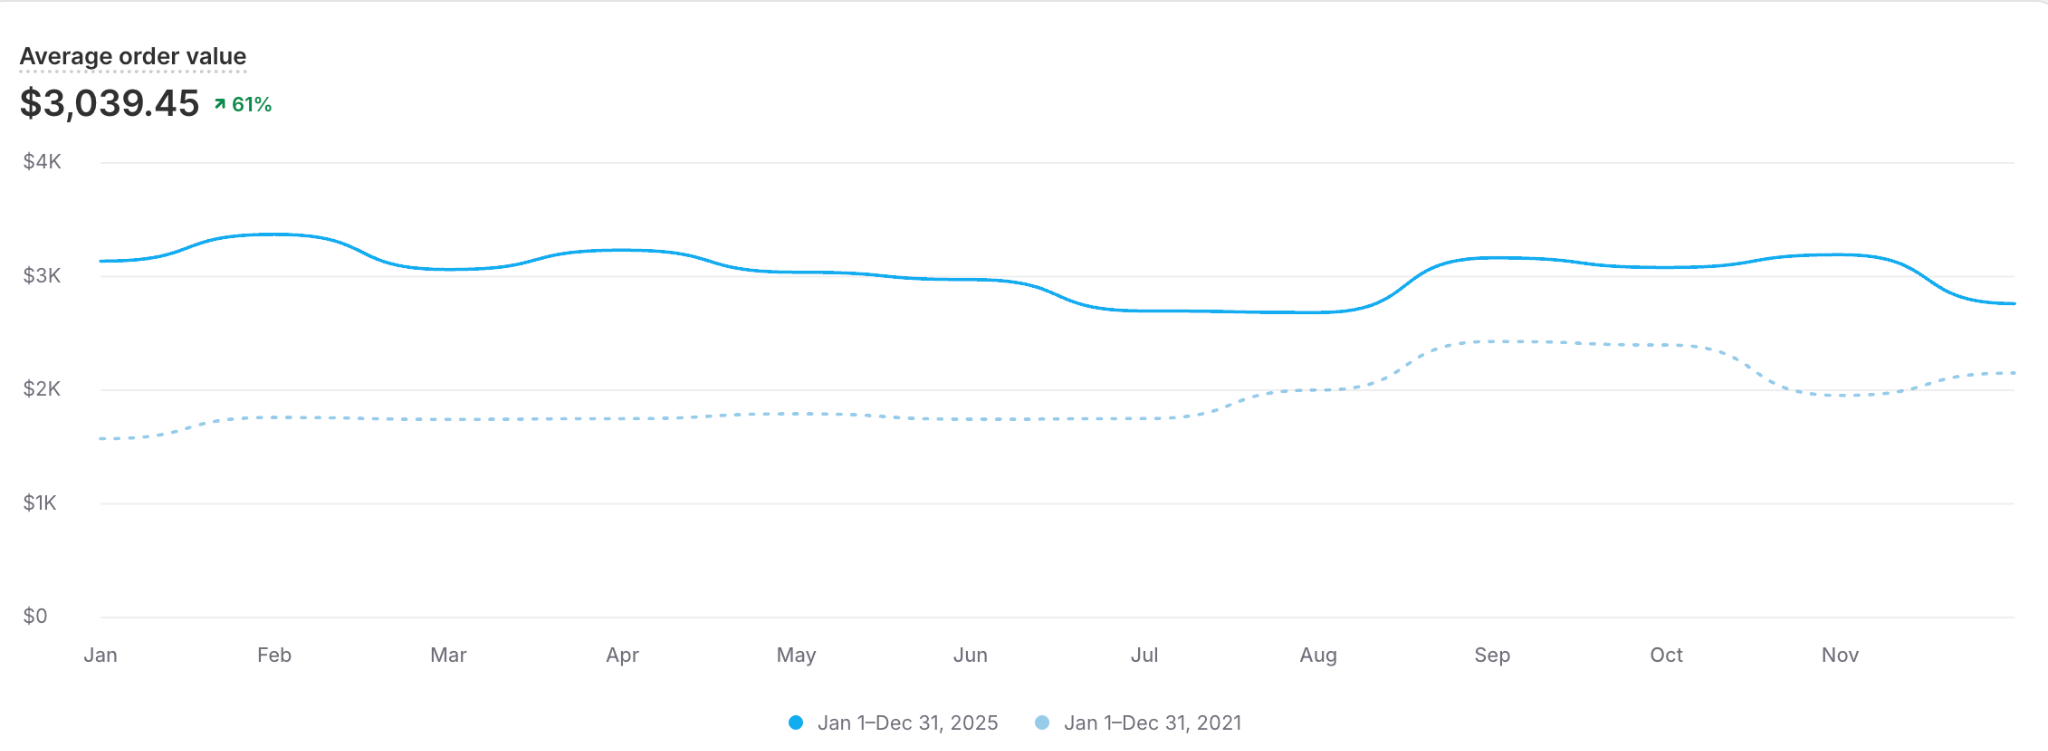
Average order value up 61% to $3,039

2025 against 2021 on the same store. In furniture, AOV decides how far paid media can scale: at $3,000 an order, cost per acquisition stops being the constraint and margin does the work.

SHOPIFY :: BLACK_FRIDAY
Client platform export, unedited
Swipe to pan the full dashboard
Client platform export, unedited
Jennifer Furniture · United States

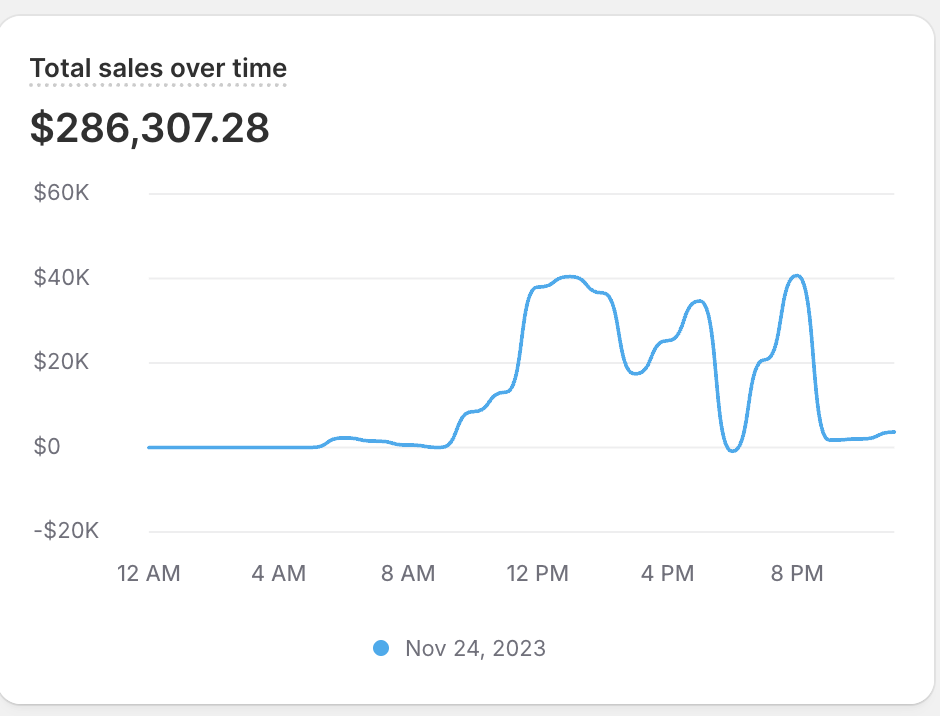
$286K in a single Black Friday, repeated three years running

$286K in 2023, $221K in 2024, $214K in 2025. Peak days like this are won in the eleven months before them, in feed structure, list health and creative that is already tested.

KLAVIYO :: CAMPAIGN_PERFORMANCE
Client platform export, unedited
Swipe to pan the full dashboard
Client platform export, unedited
Jennifer Furniture · United States

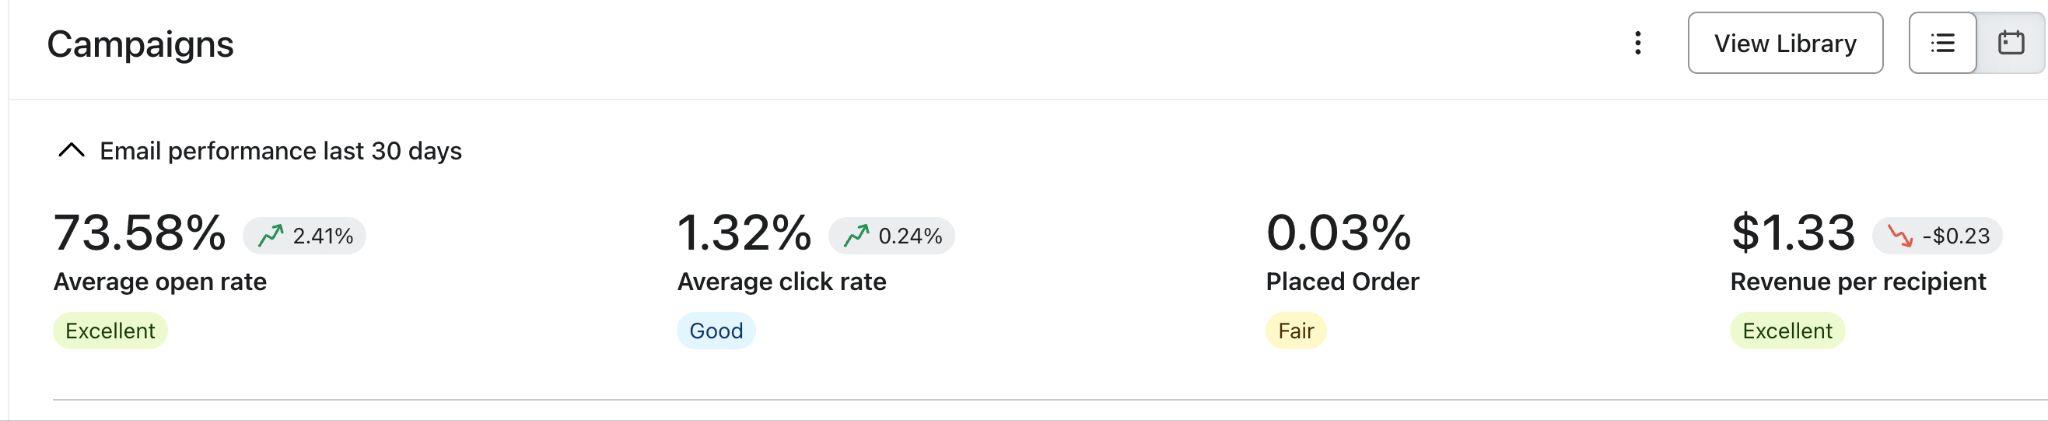
73.58% average open rate, $1.33 revenue per recipient

Email performance over a rolling 30 days, with click rate up to 1.32%. On a list this size, $1.33 of revenue for every recipient means the send calendar pays for the whole retention program several times over.

KLAVIYO :: FLOW_PERFORMANCE
Client platform export, unedited
Swipe to pan the full dashboard
Client platform export, unedited
Jennifer Furniture · United States

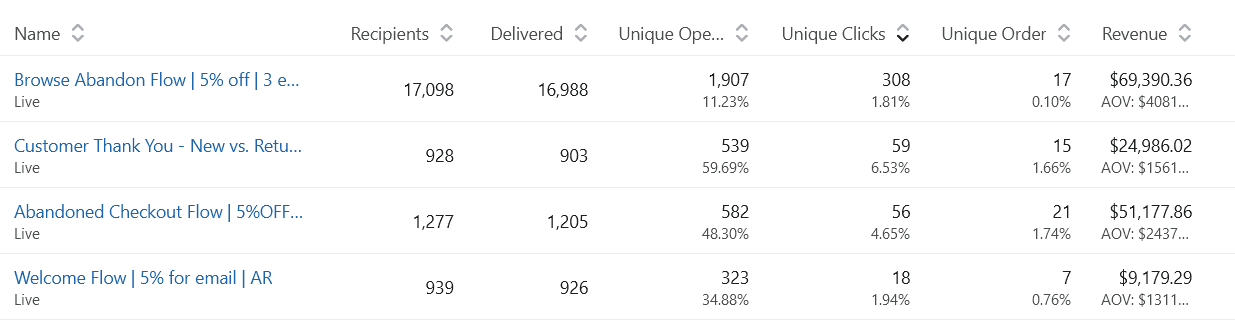
$69.4K from one browse abandon flow

Lifecycle flows carrying $4,081 and $2,437 average order values on autopilot. For a $2K to $3K purchase, email is not a promo channel, it is the thing that removes hesitation over a long decision cycle.

OMNISEND :: SALES_PERFORMANCE
Client platform export, unedited
Swipe to pan the full dashboard
Client platform export, unedited
Furniture retailer · United States

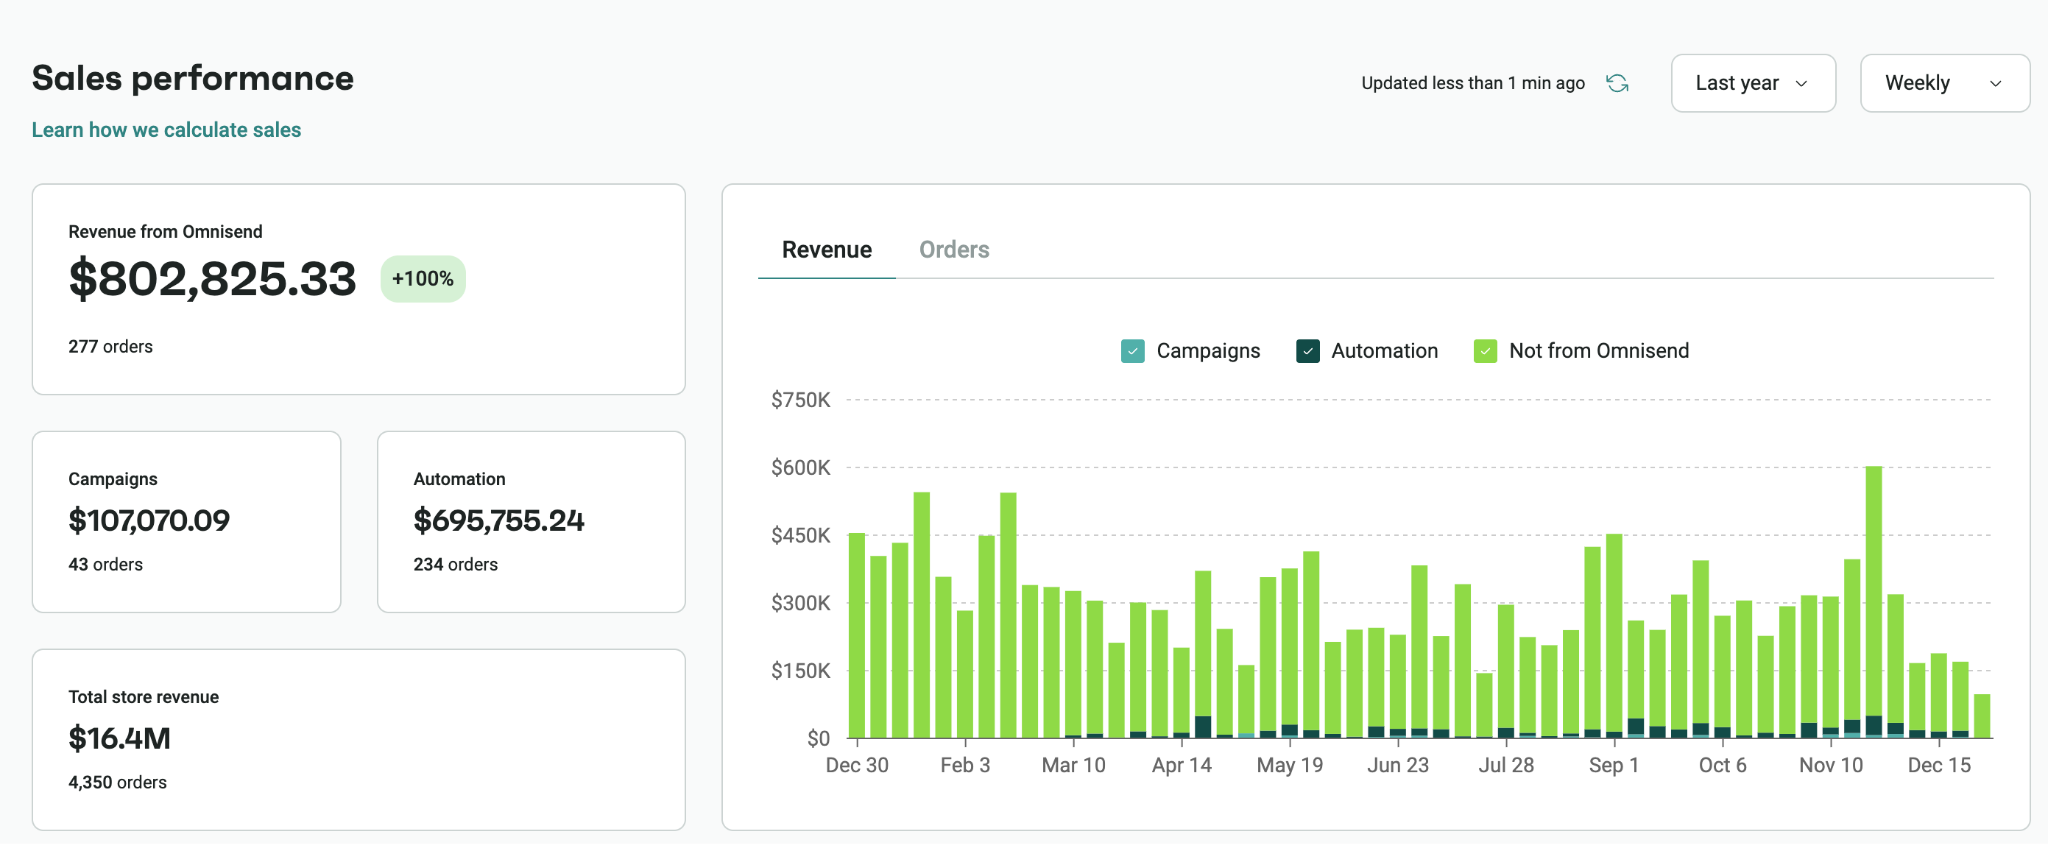
$802.8K from email on a $16.4M store

Automation contributed $695.8K of it against $107.1K from campaigns. That ratio is the goal: revenue built into the store rather than dependent on the next send.

SHOPIFY :: FOUR_YEAR_VIEW
Client platform export, unedited
Swipe to pan the full dashboard
Client platform export, unedited
Furniture retailer · United States

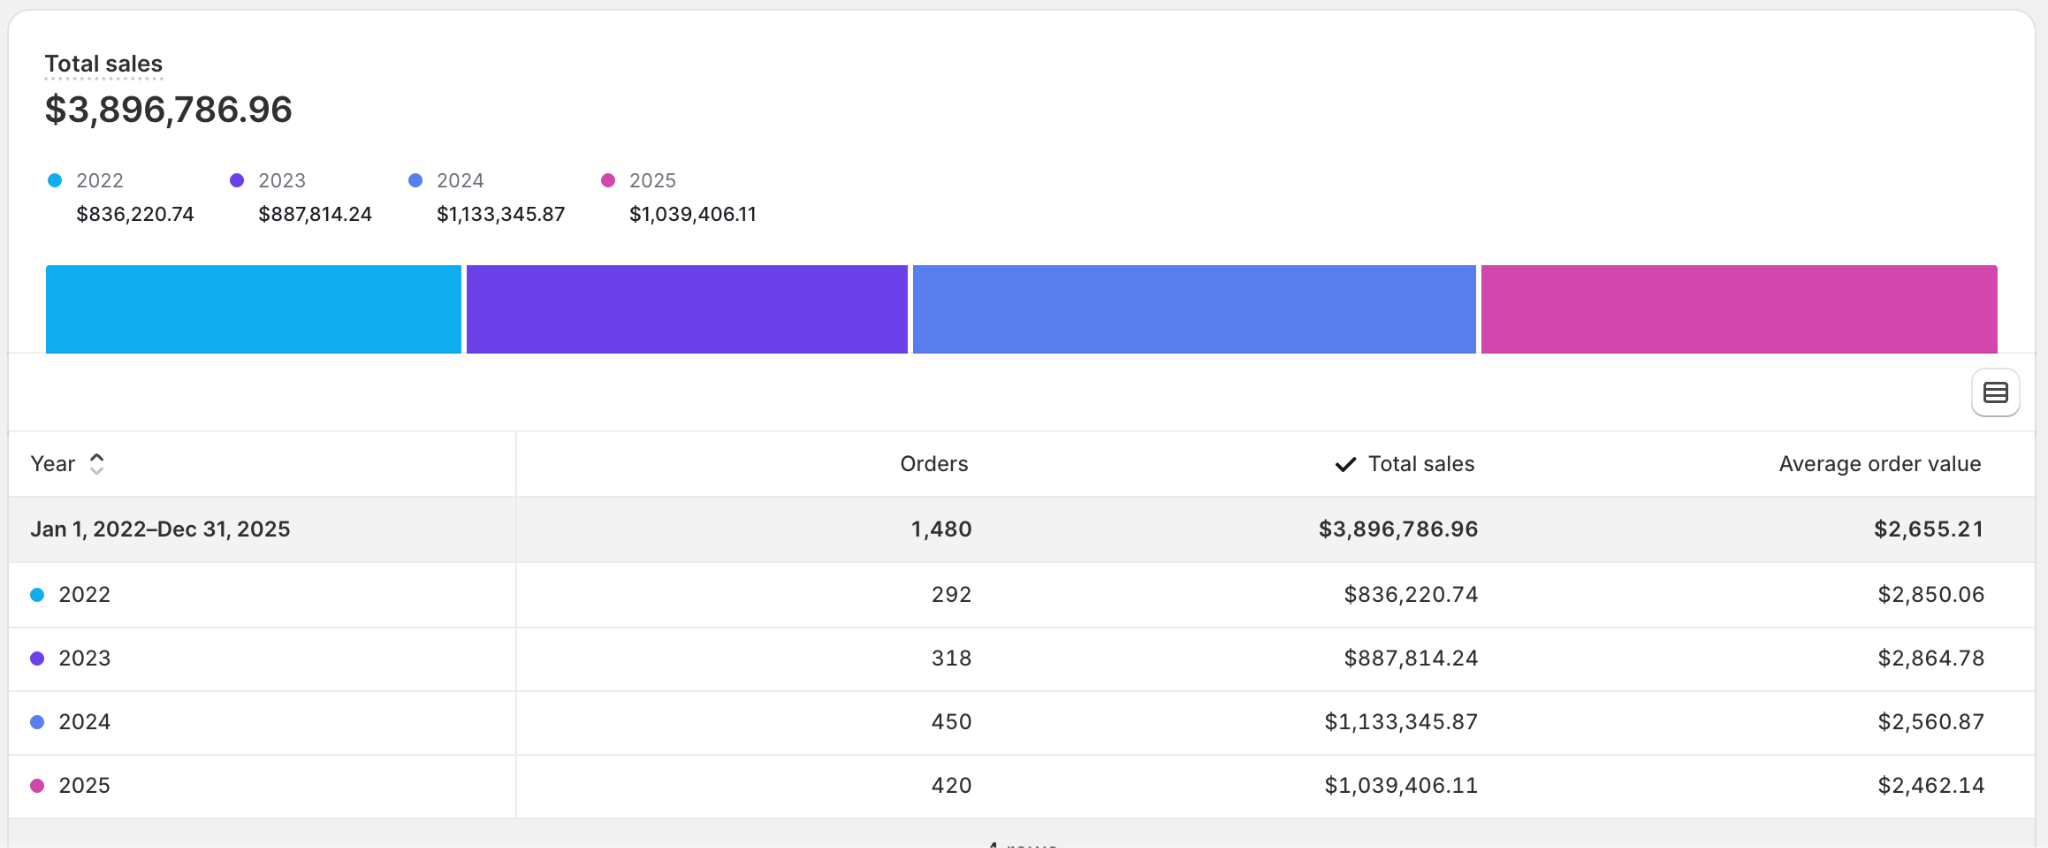
$3.9M across four years at a $2,655 average order

1,480 orders between 2022 and 2025 on a second furniture store in the portfolio. Small order counts at high ticket values need a completely different acquisition model to volume ecommerce.

SHOPIFY :: FOUR_YEAR_VIEW
Client platform export, unedited
Swipe to pan the full dashboard
Client platform export, unedited
Furniture retailer · United States

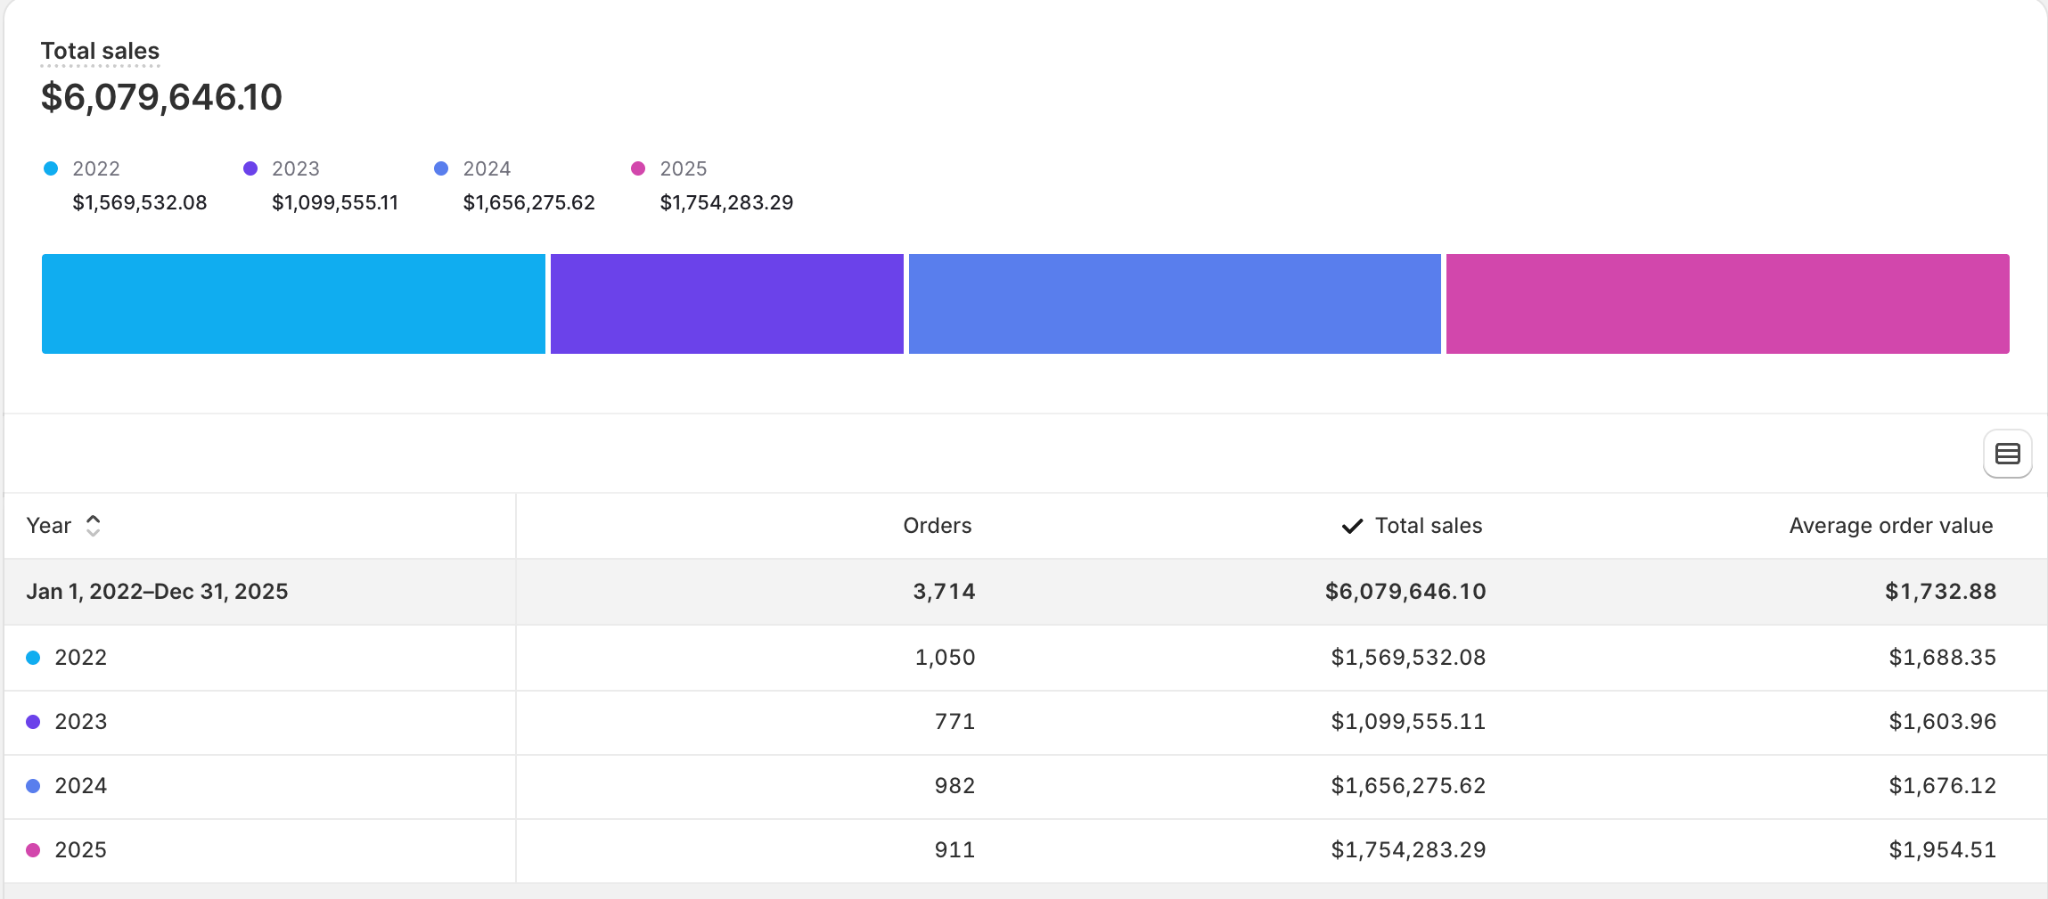
$6.1M across four years, with AOV climbing to $1,955

3,714 orders between 2022 and 2025, and the average order value rising in the most recent year rather than being discounted down to hold volume.

GOOGLE ADS :: CONVERSION_VALUE
Client platform export, unedited
Swipe to pan the full dashboard
Client platform export, unedited
The Basics Woman · India

12.66x return on Google Ads spend

₹112K of spend against a 12.66 conversion value per cost ratio, at a ₹7.21 average CPC across 980 purchases. Search intent captured cheaply because the feed and the landing paths were fixed first.

SHOPIFY :: FULL_YEAR_2025
Client platform export, unedited
Swipe to pan the full dashboard
Client platform export, unedited
Skincare brand · India

₹196.4 crore in a single year, up 86%

Total store sales for calendar 2025 against 2024, on a store running at roughly ₹16 to ₹24 crore a month. This is the scale of account our team is used to operating in, and volume like this changes how you structure everything from feed logic to lifecycle sending.

SHOPIFY :: APRIL_2026
Client platform export, unedited
Swipe to pan the full dashboard
Client platform export, unedited
Skincare brand · India

₹35.06 crore gross sales in one month, up 101%

April 2026 against March: gross sales doubled, 2,86,412 orders fulfilled, and a 44.53% returning customer rate. Nearly half of revenue coming from repeat buyers is the retention layer doing its job behind the paid spend.

SHOPIFY :: YTD_2026
Client platform export, unedited
Swipe to pan the full dashboard
Client platform export, unedited
Skincare brand · India

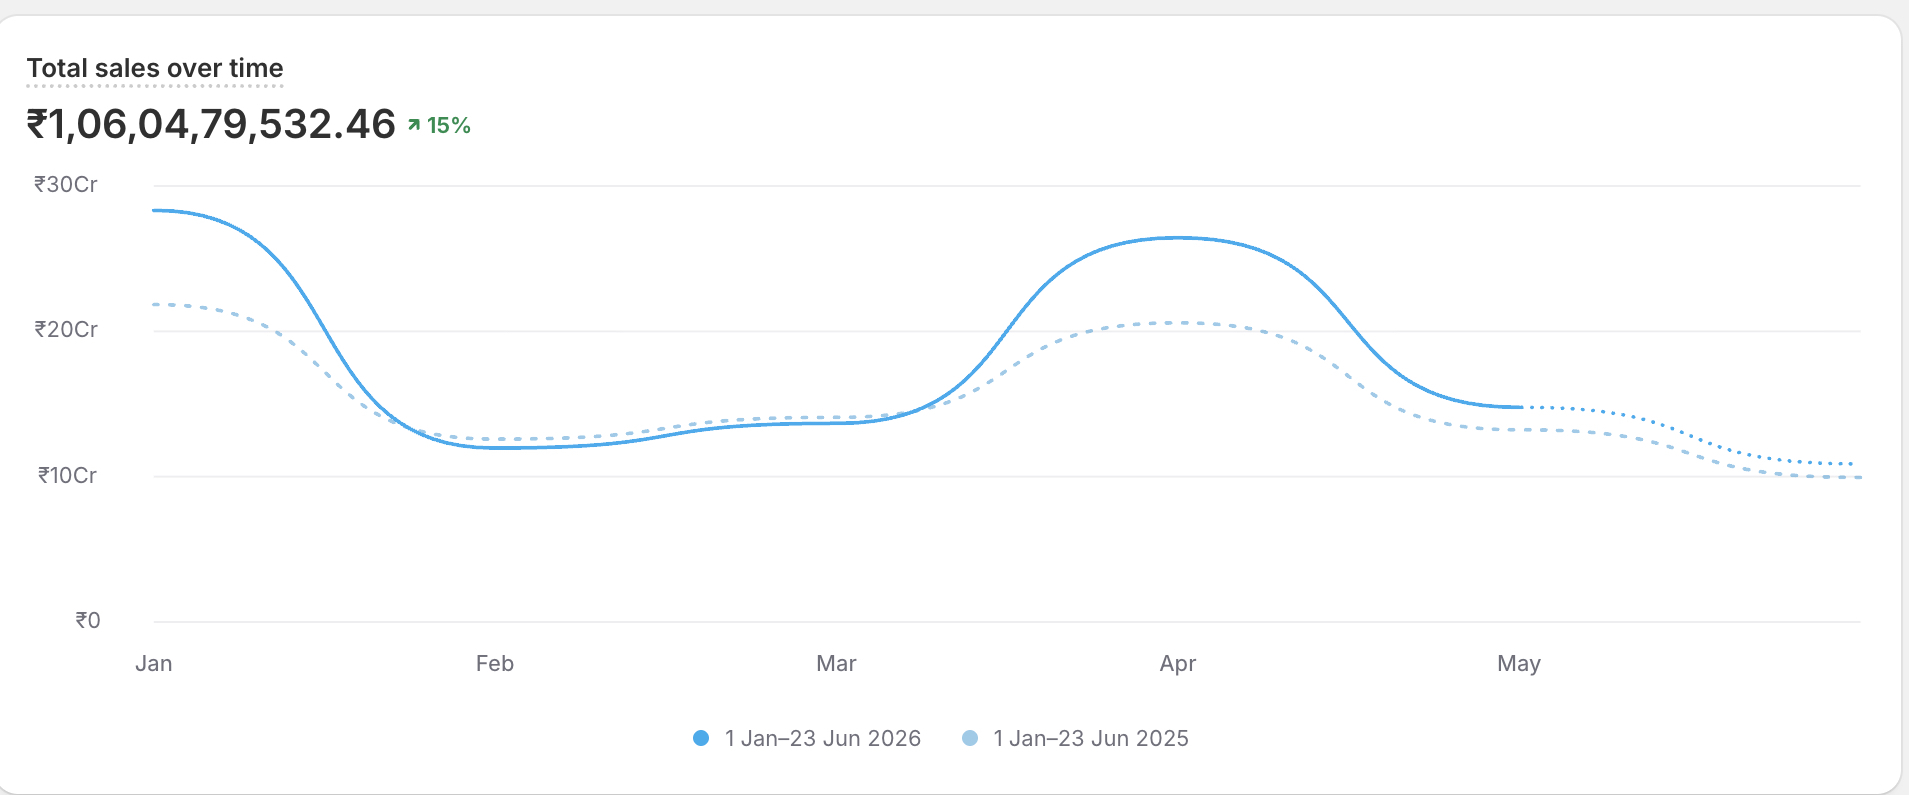
₹106 crore year to date, up 15% on last year

Same store, first half of 2026 compared with the same window in 2025. Growth compounding on top of a year that had already doubled is the harder problem, and it is won on efficiency rather than new spend.

KLAVIYO :: CONVERSION_SUMMARY
Client platform export, unedited
Swipe to pan the full dashboard
Client platform export, unedited
Food & beverage DTC · India

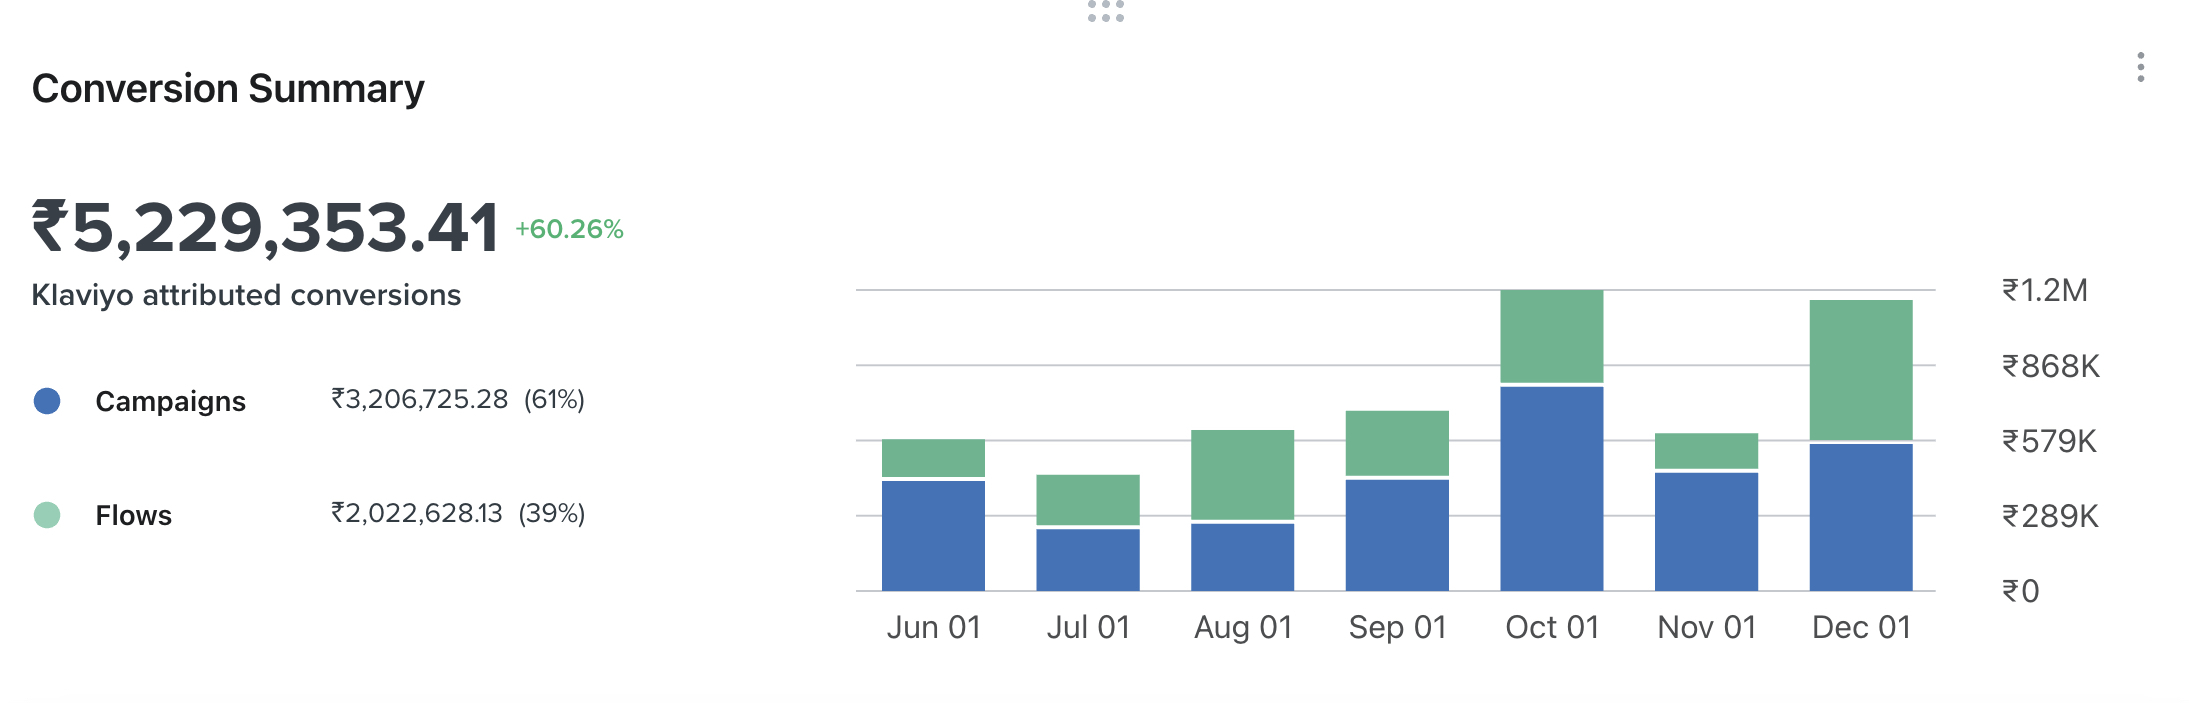
₹52.3 lakh attributed to email, up 60.26%

Seven months of Klaviyo attributed revenue, split 61% campaigns and 39% flows. The flow share is the part that keeps arriving in a quiet week, which is why we build it before we scale sending volume.

OMNISEND :: STORE_PERFORMANCE
Client platform export, unedited
Swipe to pan the full dashboard
Client platform export, unedited
Food & beverage DTC · India

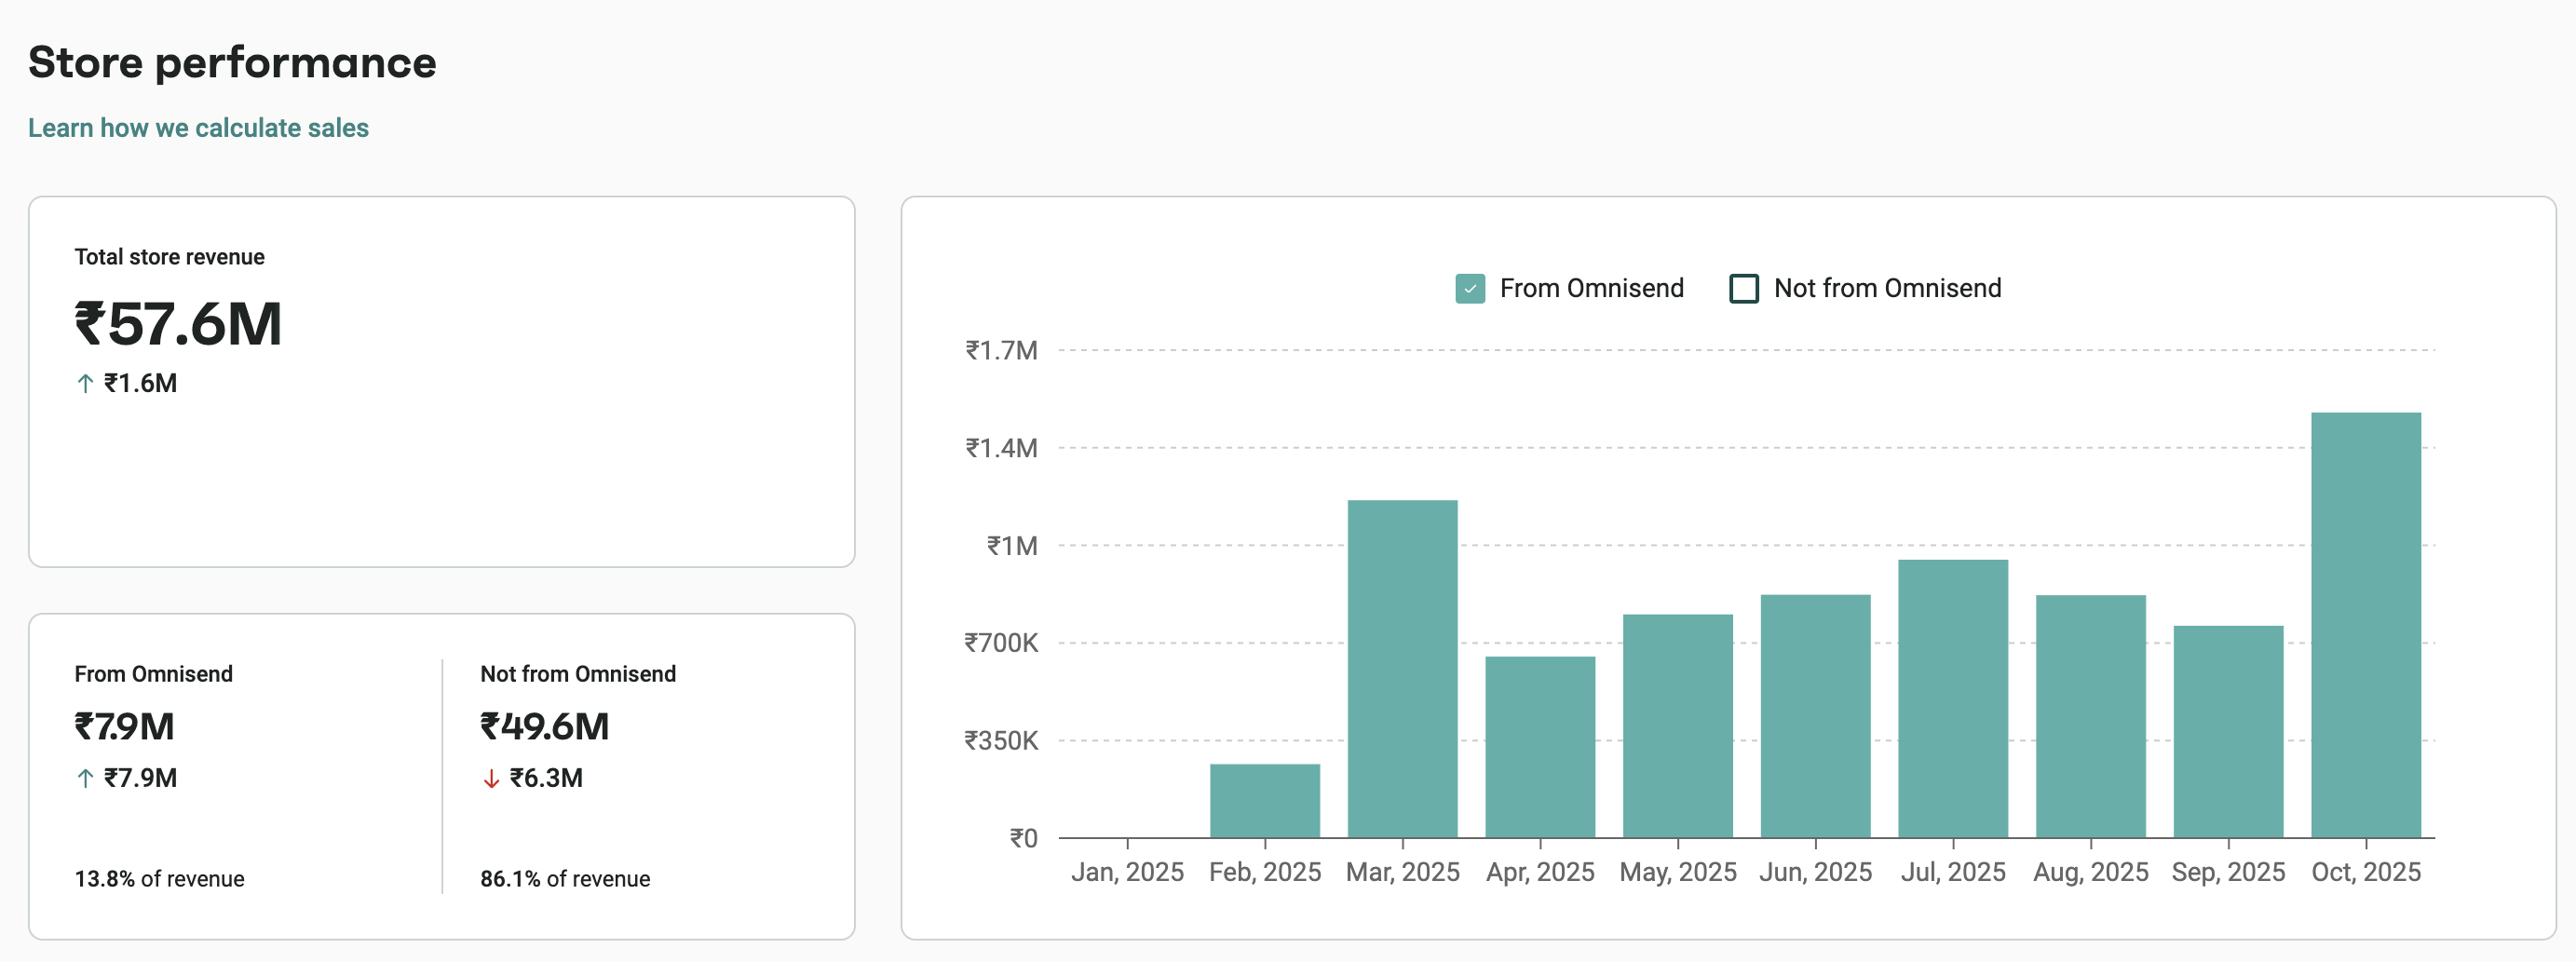
₹79 lakh of ₹5.76 crore store revenue from email

13.8% of total store revenue traced back to owned channels across 4,514 attributed orders, from a starting point where email was contributing effectively nothing.

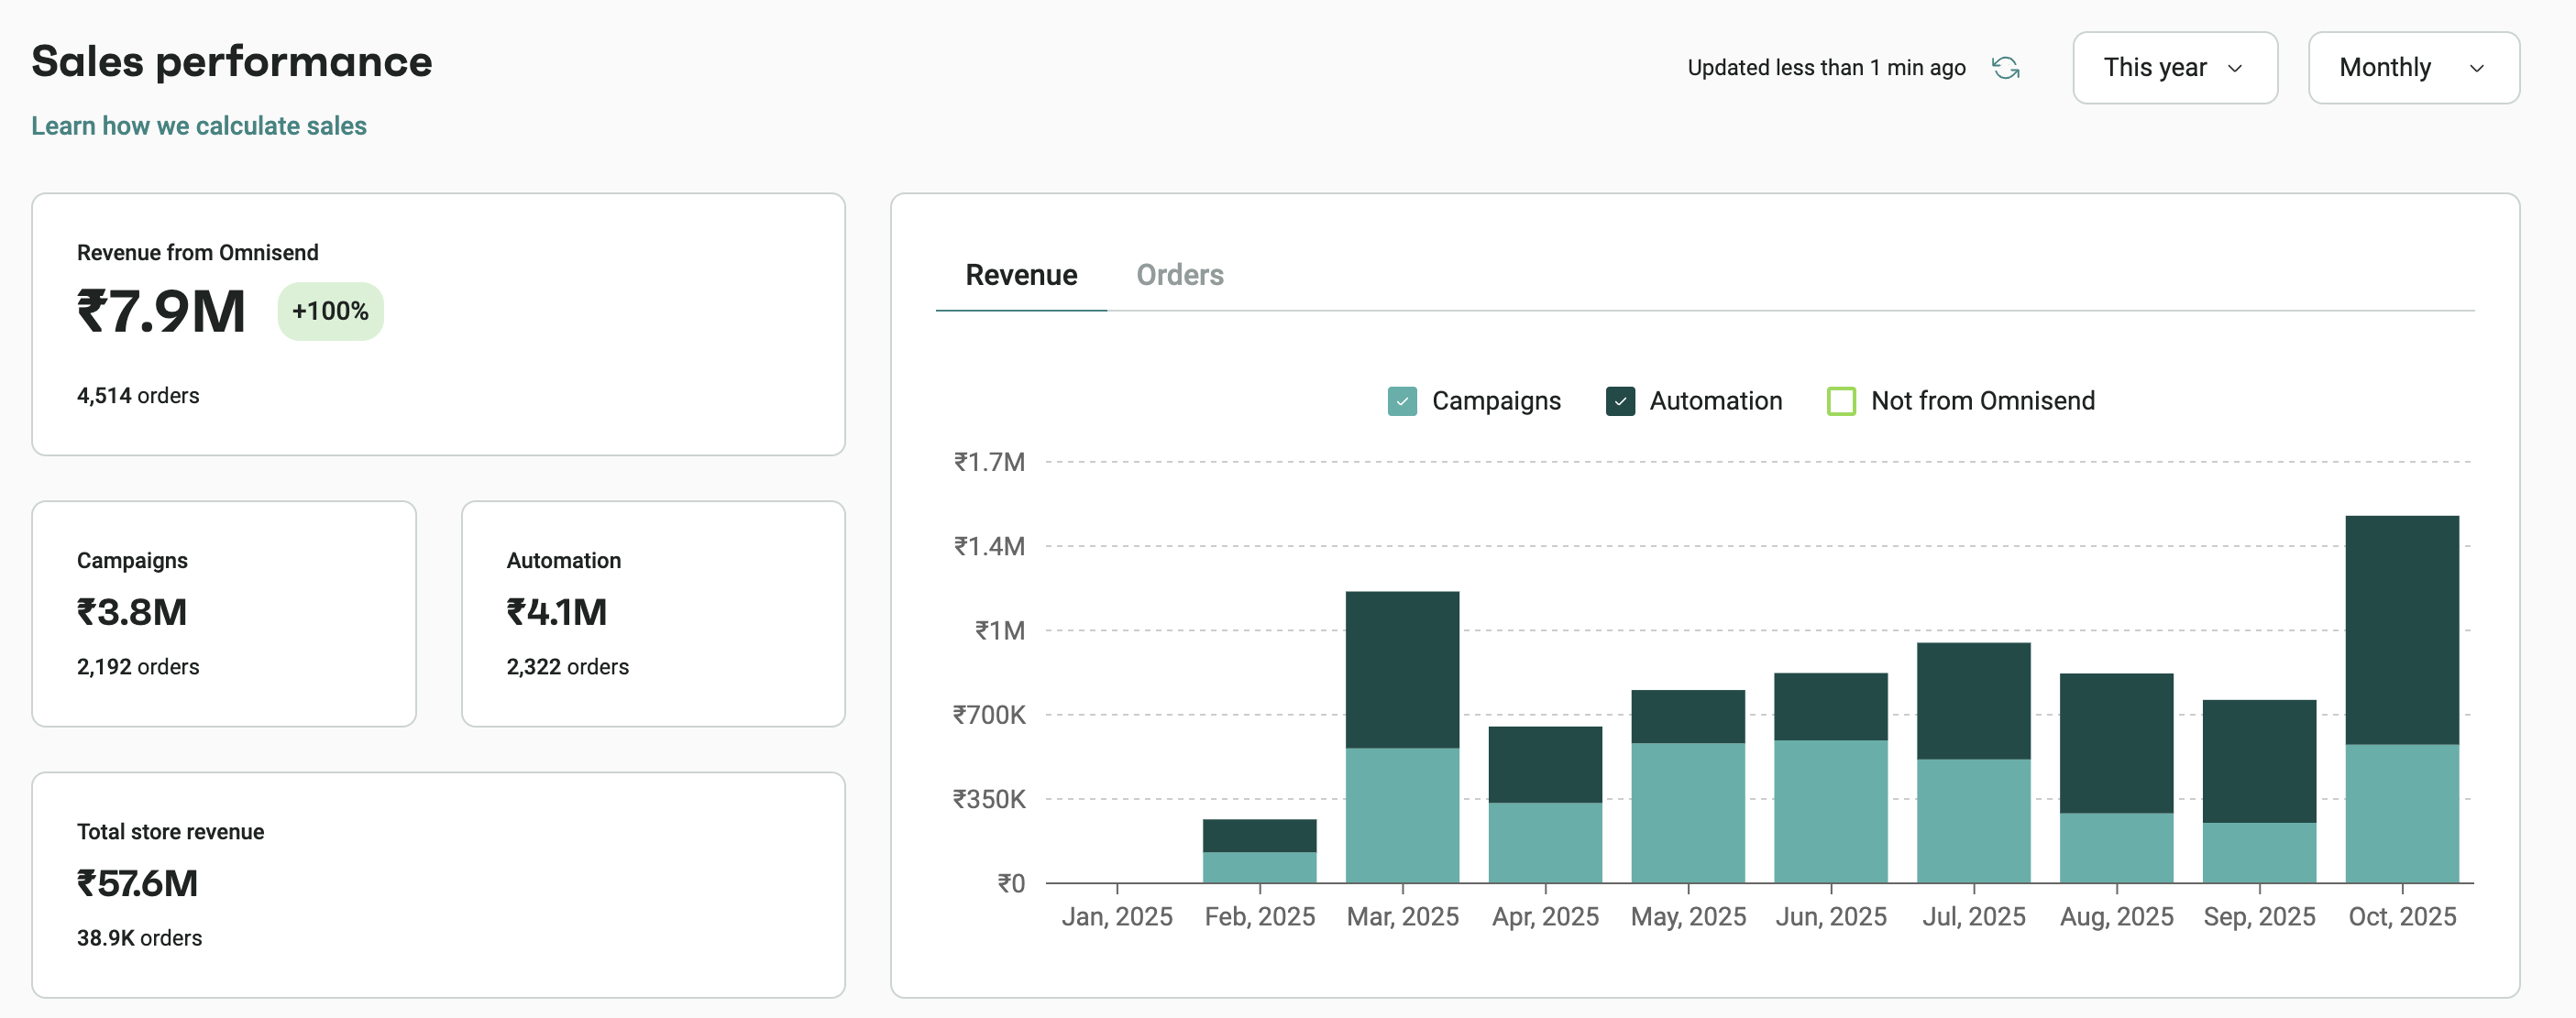
OMNISEND :: CAMPAIGNS_VS_AUTOMATION
Client platform export, unedited
Swipe to pan the full dashboard
Client platform export, unedited
Food & beverage DTC · India

₹3.8M campaigns, ₹4.1M automation

Automation out-earning campaigns is the target state. It means the revenue is built into the store rather than depending on someone remembering to send.

OMNISEND :: AUDIENCE_GROWTH
Client platform export, unedited
Swipe to pan the full dashboard
Client platform export, unedited
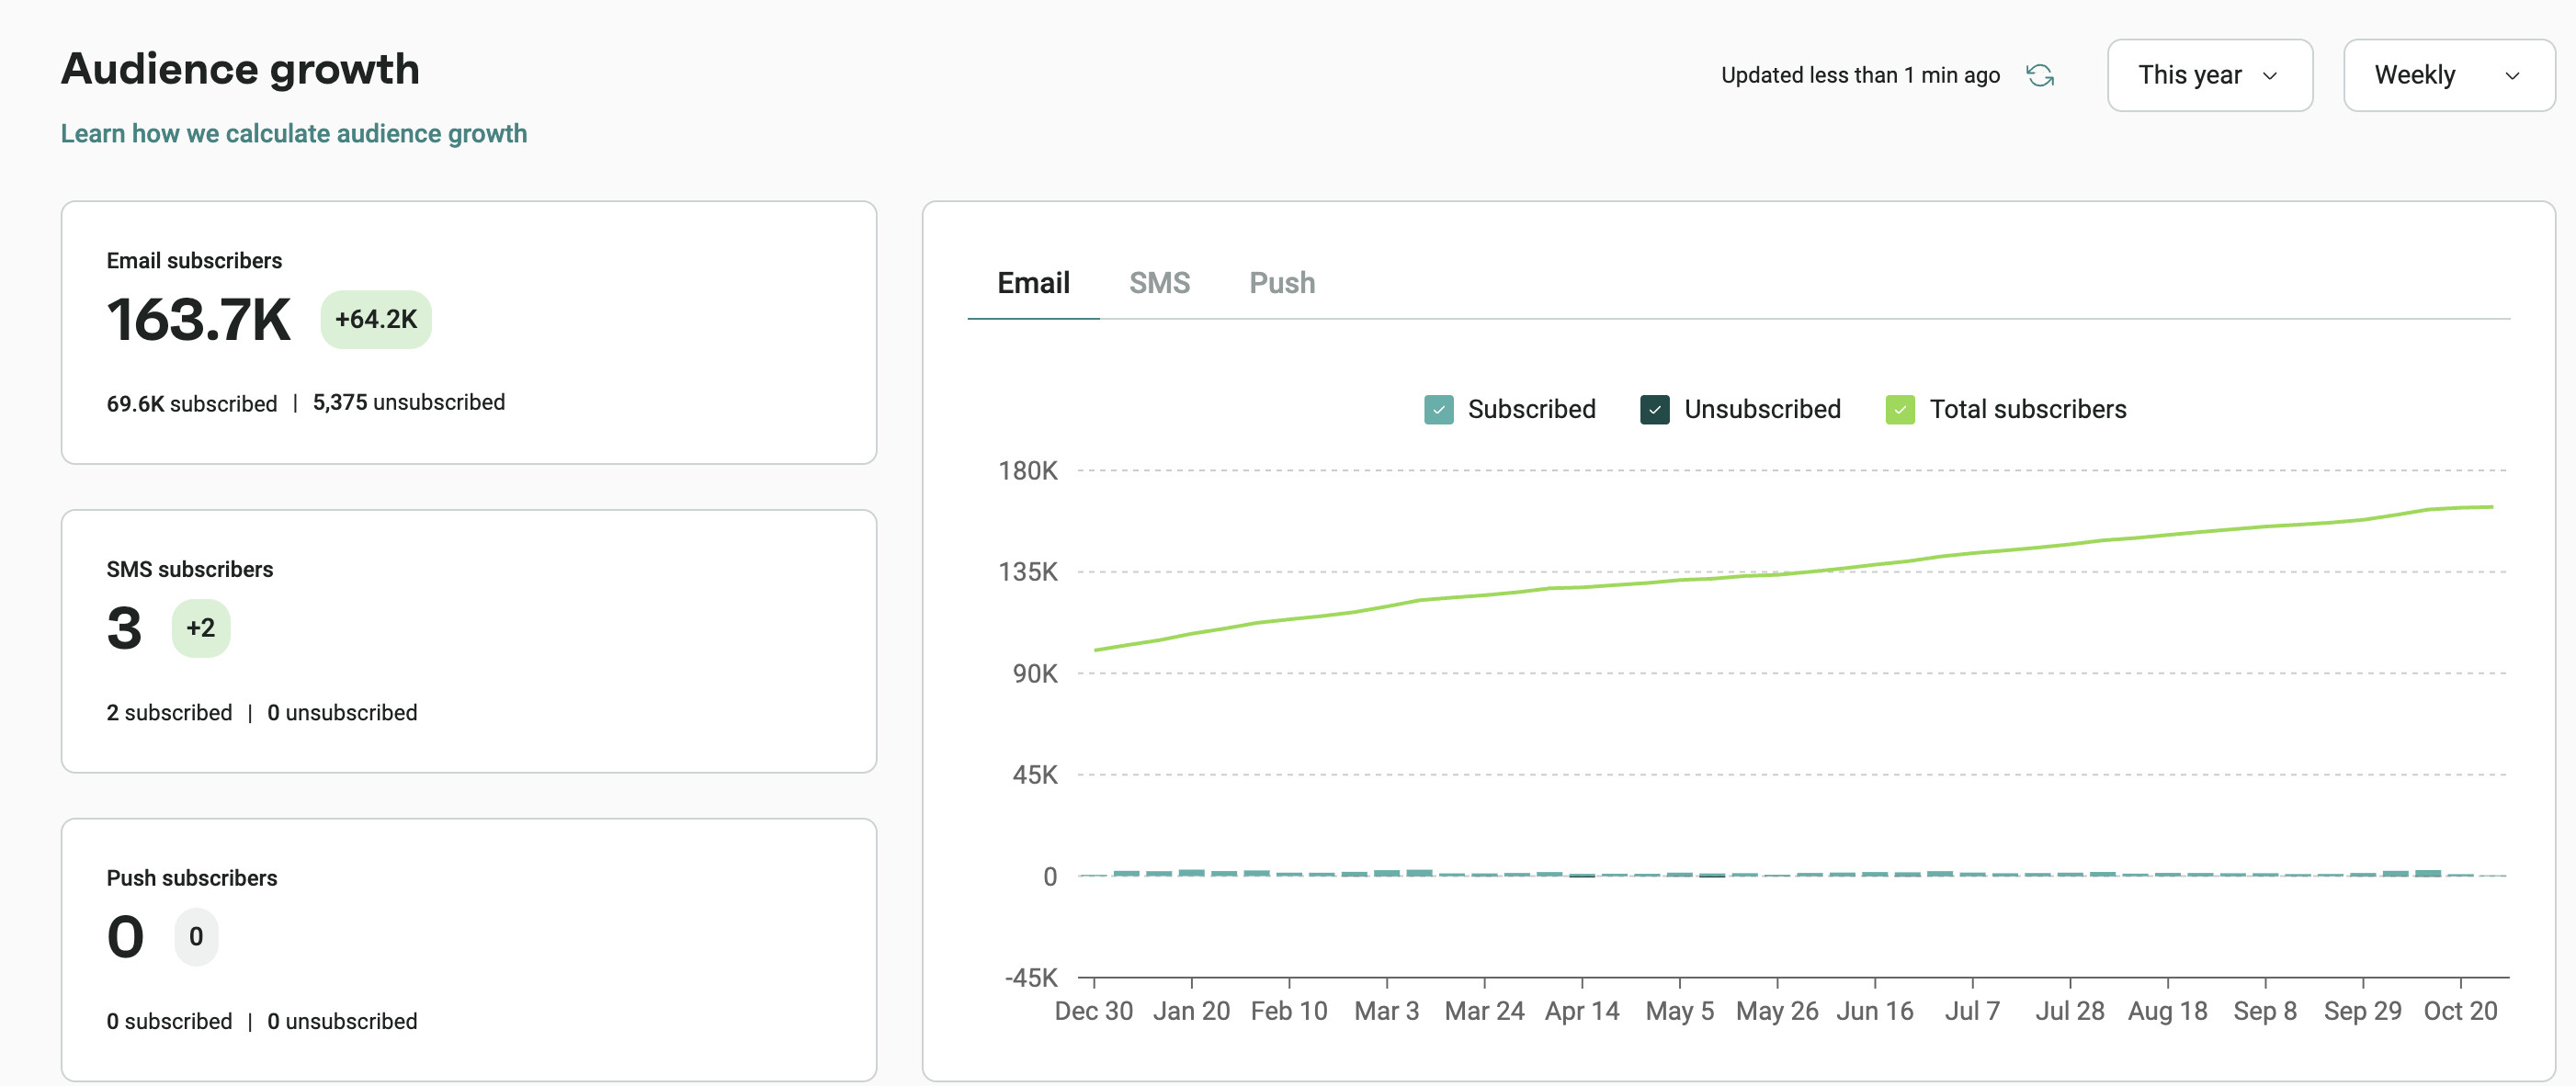
Food & beverage DTC · India

163.7K email subscribers, up 64.2K in the year

A steady climb rather than a step change, built from on-site capture and reactivation. Bought lists move this line faster and destroy deliverability doing it.

Named engagement

NextGen AI Technologies

An AI workforce platform raising capital while building a dealer network. We run the growth and technology side of it as one engagement, rather than as separate vendors handing files to each other.

  • Website and designThe investor funding page and supporting pages, designed and built in house.
  • Technology setupTracking, integrations and the operational stack behind the funnel, configured so the data is trustworthy before spend goes live.
  • Performance for awareness and the raisePaid media aimed at two outcomes at once: category awareness for a new product, and qualified investor interest into the round.
  • Performance marketing for their clientsWe also run acquisition for businesses inside their network, which means the platform sells growth outcomes rather than software licences.
View the site ↗
INVEST.NEXTGENTECHNOLOGIES.AI
NextGen investor page
Designed and built by Essor Partners

Want to see the actual dashboards?

We walk through the raw platform screenshots on the first call. No edited slides, no cherry-picked date ranges.

Message Omkar on LinkedIn
Across the portfolio

Eighty brands, one pattern.

Anonymised by category where agreements require it. Combined record of both partners.

Fashion & lifestyle DTC · 6 markets
10x
₹30L to ₹3Cr a month in 6 months at 3.5 ROAS
Food & beverage DTC · India
100x
₹2L to ₹2Cr a month, built from day zero
Premium skincare · high ticket
6x
₹15L to ₹1Cr a month, ROAS 1.4 to 2.7
Health & wellness · launch
₹40L
Zero to ₹40L a month in 3 months, no discounting
US furniture DTC · $15M a year
$180K
Monthly email revenue built from near zero
Women's supplements · India
3x
Revenue in 90 days, new-customer CAC down 40%
US ecommerce portfolio · 8 brands
$14M
Sales from $4M of spend, 3.5x blended
Enterprise paid social · BFSI, OTT, beauty
₹7Cr
Monthly budgets managed inside a global agency
Fashion & lifestyle DTC · 6 markets
10x
₹30L to ₹3Cr a month in 6 months at 3.5 ROAS
Food & beverage DTC · India
100x
₹2L to ₹2Cr a month, built from day zero
Premium skincare · high ticket
6x
₹15L to ₹1Cr a month, ROAS 1.4 to 2.7
Health & wellness · launch
₹40L
Zero to ₹40L a month in 3 months, no discounting
US furniture DTC · $15M a year
$180K
Monthly email revenue built from near zero
Women's supplements · India
3x
Revenue in 90 days, new-customer CAC down 40%
US ecommerce portfolio · 8 brands
$14M
Sales from $4M of spend, 3.5x blended
Enterprise paid social · BFSI, OTT, beauty
₹7Cr
Monthly budgets managed inside a global agency
The team

Partner-led.
Team-supported.

Two partners own every engagement and stay on every call. Behind us sits a specialist team covering creative, design, development, campaign operations and analytics, so the strategy does not stall at execution.

OSOmkar Sangle

Omkar Sangle

Partner · Growth & retention

Six-plus years inside DTC growth teams across the United States, India and the UK. Built and ran the growth function at a $15M-a-year Jennifer Furniture as Head of Growth and Retention, leading a 42-member team.

Specialises in retention infrastructure, paid and marketplace acquisition, CRO, and the unit economics layer that tells you whether any of it is working. Also builds Metic, a SaaS platform for automated Klaviyo audits.

$24M+
Revenue influenced
50+
Brands scaled
42
Largest team led
6+ yrs
DTC growth
AGAshwin Gogawale

Ashwin Gogawale

Partner · Paid social & media buying

Large-agency background at a dentsu group performance agency, where he managed rupees 5 to 7 crore in monthly ad budgets for national telecom, beauty, banking and streaming accounts.

Now focused on Meta infrastructure, creative strategy and scaling DTC and B2B brands. Reports over rupees 93 crore in revenue influenced across the last three years, and regularly audits accounts spending $100K a month.

₹93Cr+
Revenue influenced
60+
Brands scaled
₹5-7Cr
Monthly spend managed
Ex-dentsu
Performance agency
The wider team

Specialists, not generalists with job titles.

Strategy is worthless if execution is slow. Every discipline below is covered by people who do only that.

Creative & production

Led by Anirudha Gogawale, seven-plus years in ecommerce creative. Static ad creative, motion graphics, video editing and brand identity, at enough throughput to keep creative testing weekly rather than monthly.

Design & development

UI and UX design, Shopify and WordPress development, and landing page builds. The same team that ships the site ships the CRO tests against it.

Campaign operations

Day-to-day build and QA across Meta, Google, Amazon and the retention stack, so partner time goes to strategy and diagnosis rather than upload work.

Analytics engineering

Tracking implementation, server-side events, and reporting builds in Looker Studio. Measurement is set up before spend moves, not after someone asks a hard question.

How we take on work

Deliberately few clients.

Most agencies sell you a senior pitch and staff the work with juniors. We take on a small number of engagements at a time, so the person on your call is the person in your ad account.

It caps how fast we can grow. It also means the work does not quietly degrade after month two, which is the complaint we hear about almost every agency a founder has used before us.

Talk to a partner, not a salesperson.

Message Omkar directly on LinkedIn. It reaches a partner, not an inbox someone gets to on Thursday, and the first reply comes from the person who would run your account.

Message Omkar on LinkedIn
Built in house · Live product

We built the software
we run accounts with.

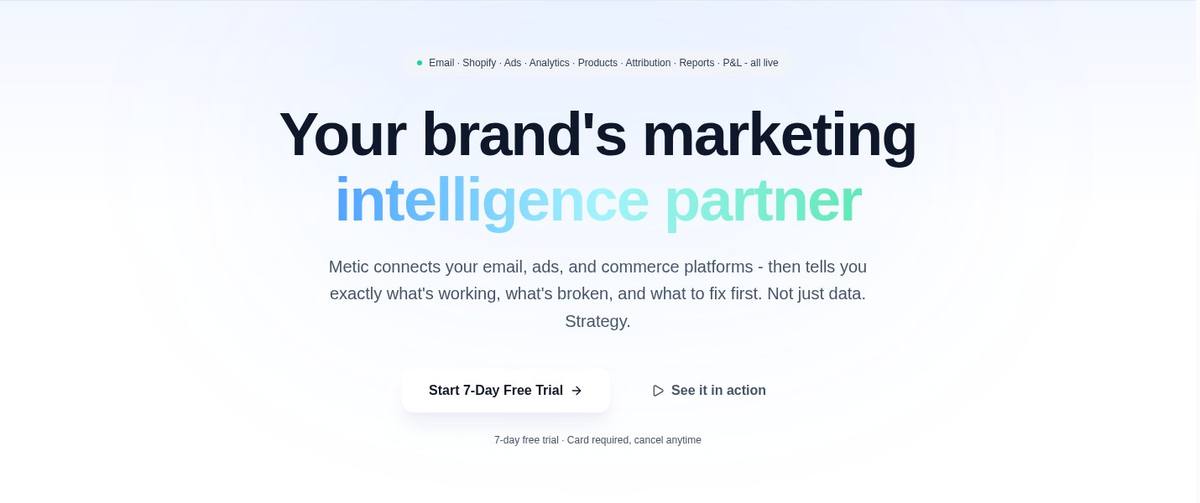
Metic connects a brand's email, ads and commerce stack, then says what is broken and what to fix first. Agencies rent their reporting. We wrote ours.

Audit intelligenceDomain healthAttributionProduct analytics Monthly P&LAsk Metic
50+Brands scanned
7Live integrations
~4 minFull account audit
METICHQ.COM
Metic landing page
Tap to enlarge
Live product, built and maintained in house
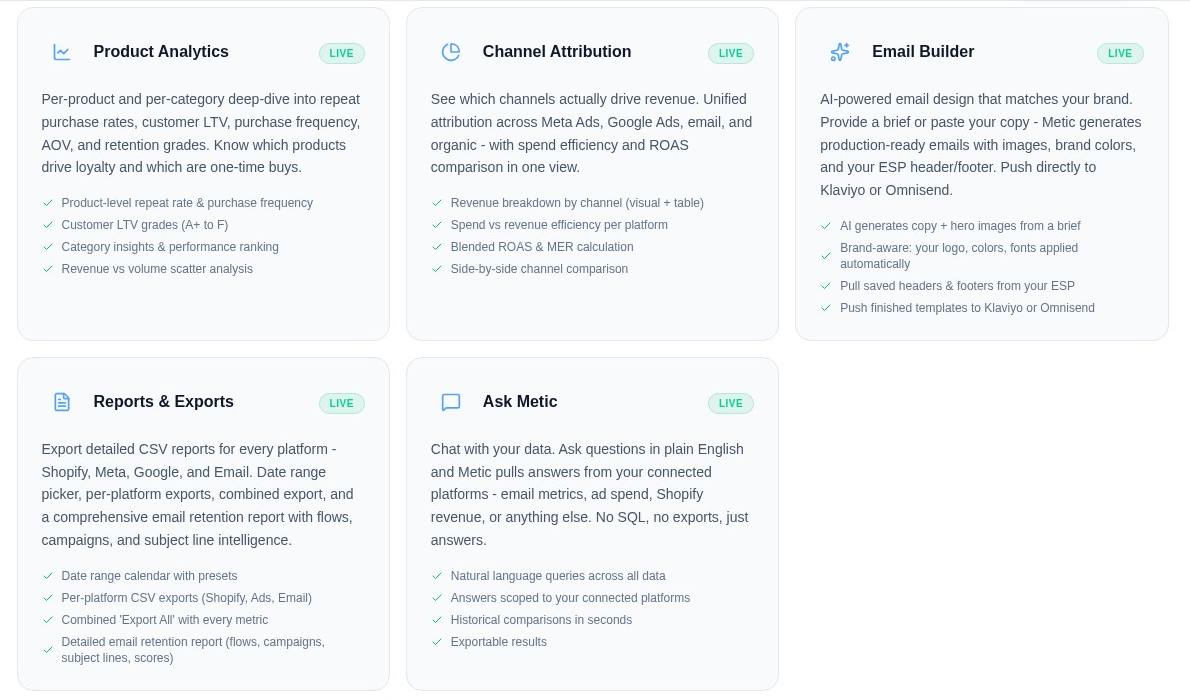
METIC :: PLATFORM MODULES
Metic modules
Tap to enlarge
Attribution, product analytics, email builder, Ask Metic

Want Metic pointed at your account?

It is included in the free audit. You get the full diagnostic whether or not you hire us afterwards.

Get Metic run on your account
Design & creative

Creative built to be tested, not admired.

Design, motion, web and SEO are real service lines here, not decoration, and they are scoped separately from the marketing retainer. Every asset below was made to be measured.

Creative capability

Creative sits in-house, led by Anirudha Gogawale, seven-plus years in graphic design and video editing. Below is live ad creative for Jennifer Furniture, the US retailer we scaled to $15M a year, running across Meta, Google and Pinterest.

Promotional static

Promotional static

Black Friday offer creative for the sofa category, priced and built for a Meta feed placement.

Seasonal campaign

Seasonal campaign

New Year sale set, one price point carried across sectionals in a single readable frame.

In-store and offer codes

In-store and offer codes

Retail-driving creative pairing a discount code with location and trust badges.

Collection and catalog

Collection and catalog

Bedroom set creative built from catalog imagery for a full-collection push.

Meta & Google staticPinterestMotion graphicsVideo editingUGC editsWebsite visualsCatalog imagerySocial organicBrand identity
Design and development

Sites we designed, built and shipped.

Web is a service line, not a side project. Full builds, from a funding page for an AI platform to local businesses that needed to look credible before they could quote a bigger job.

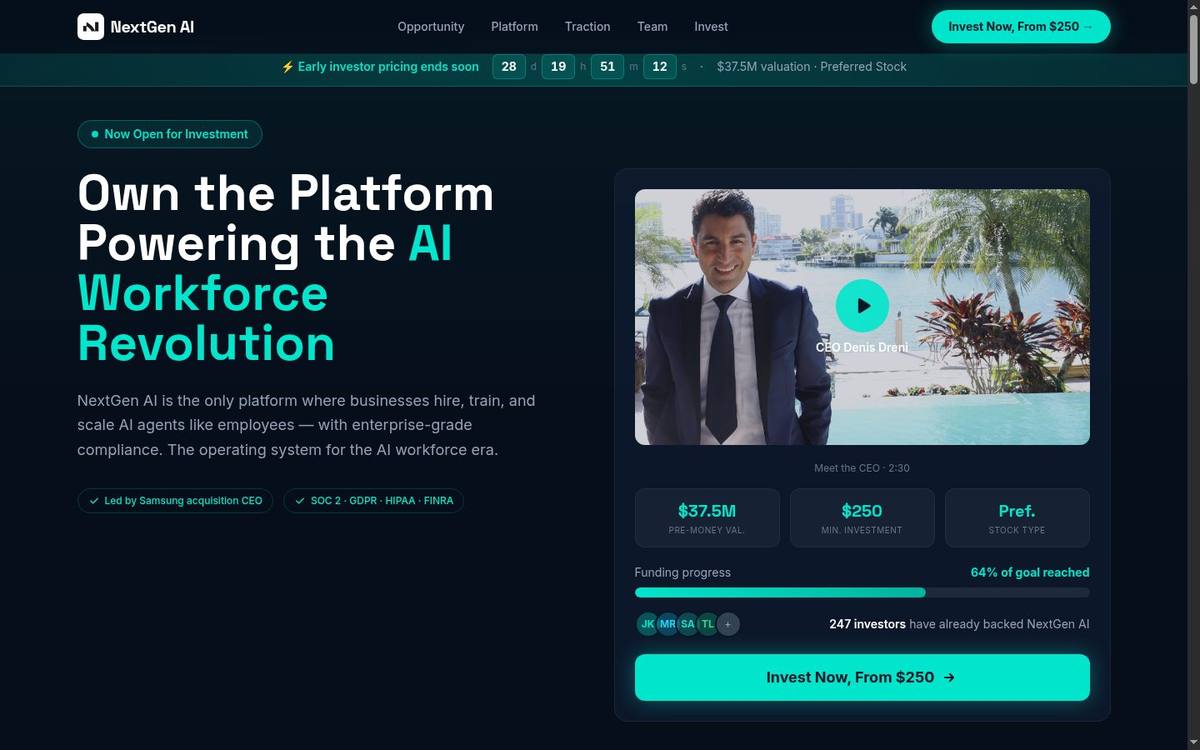
invest.nextgentechnologies.ai

NextGen AI Technologies

invest.nextgentechnologies.ai ↗

Investor funding page for an AI workforce platform, built to carry a live raise: valuation, minimum ticket, funding progress and social proof above the fold, with the compliance detail a serious investor checks before they click. Part of a wider engagement covering their tech setup and performance marketing.

DesignDevelopmentTech setupConversion copyInvestor funnel
omkarsangle.com

Growth portfolio site

omkarsangle.com ↗

Omkar's personal practice site, and the design reference this firm was built from. Proof-first layout: results before services, screenshots before adjectives.

DesignDevelopmentPositioning
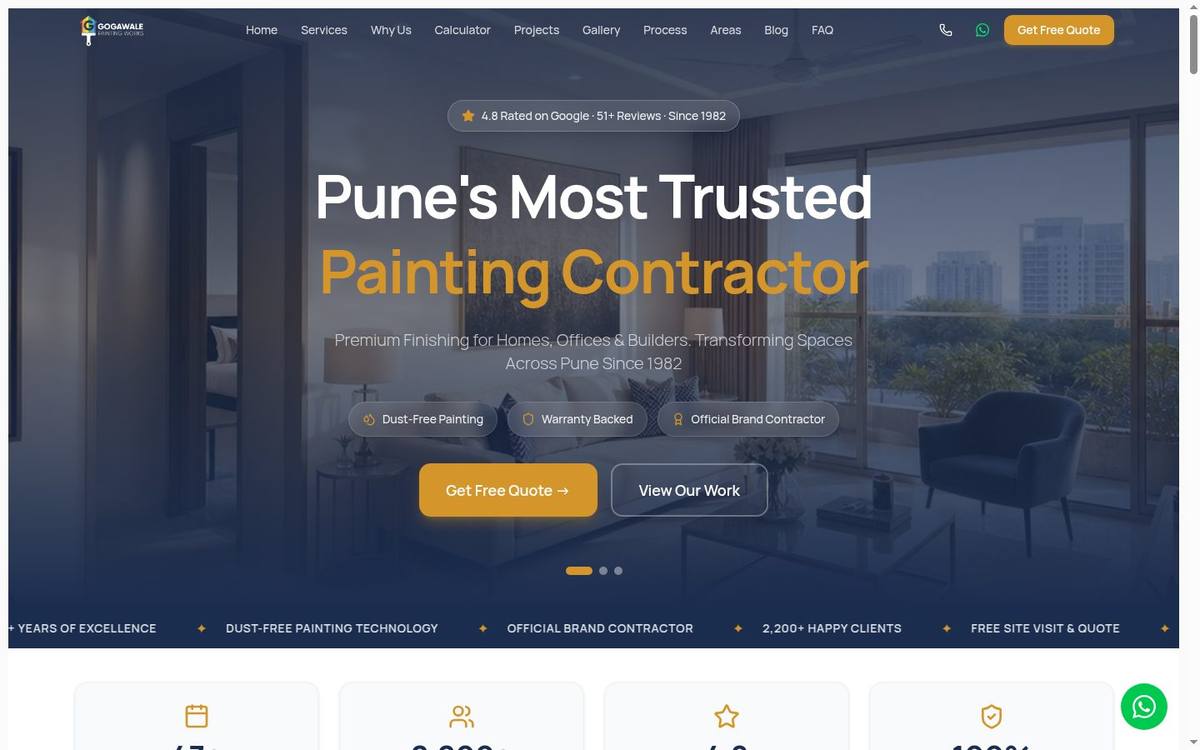
gogawalepainting.com

Gogawale's Painting Work

gogawalepainting.com ↗

A Pune painting contractor operating since 1982, with 2,200 clients and no website. Built with a live quote calculator and a Google Business Profile tied in, so the enquiries arrive qualified.

DesignDevelopmentLocal SEOQuote calculator
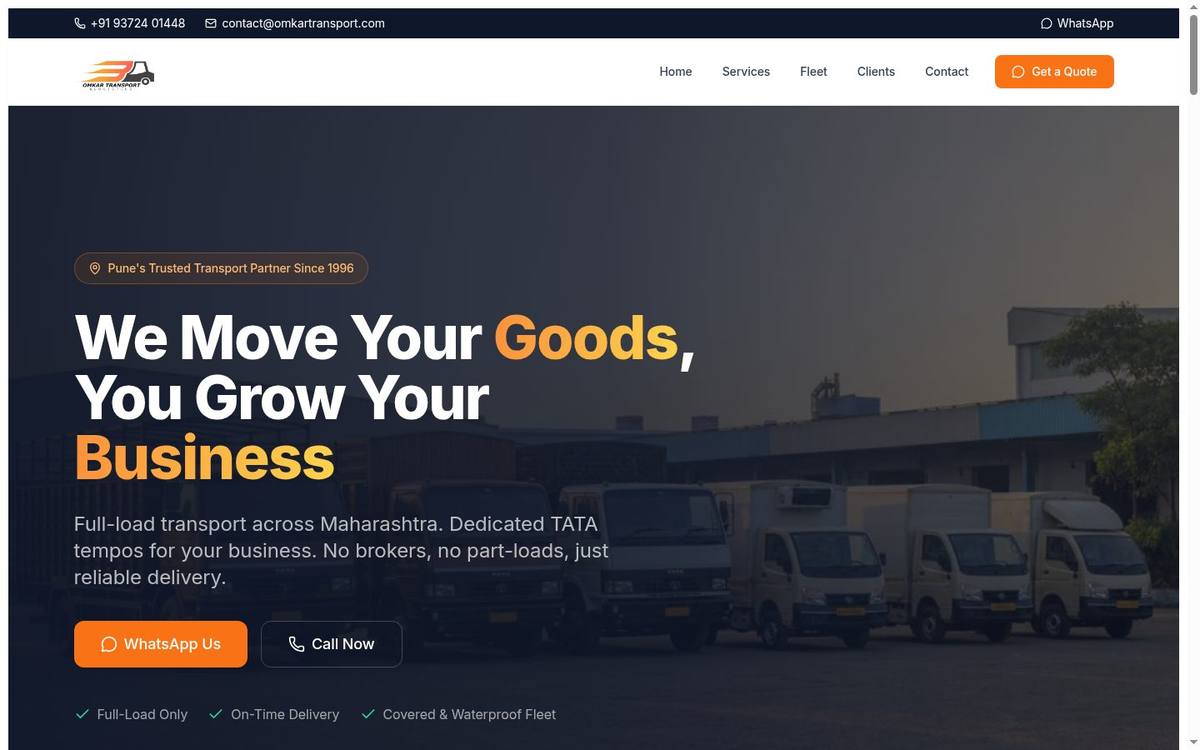
omkartransport.com

Omkar Transport

omkartransport.com ↗

Full-load transport across Maharashtra, running since 1996. A booking-led site for a business that had been living entirely on phone calls and broker referrals.

DesignDevelopmentLead capture

Static and CMS builds for local businesses are a supporting service line. The core practice is performance and growth marketing.

Need a site that actually sells?

Design, build, SEO and CRO are scoped separately from the marketing retainer, so you can start with just the site if that is what is broken.

Talk about a build
Free growth audit

Let us find the gap before you pay us anything.

Send us access to whatever you have. We come back with a written diagnostic of your acquisition, retention and conversion setup, the three biggest leaks, and what we would do first. You keep the findings either way.

What the audit covers

  • Paid mediaAccount structure, spend efficiency, creative fatigue, and where budget is buying the same customer twice.
  • RetentionFlows live versus flows missing, deliverability risk, segmentation health, and revenue attribution.
  • FunnelLeak analysis from ad click through to order confirmation, with the biggest drop-off quantified.
  • Unit economicsBlended CAC, payback period, contribution margin, and where your numbers disagree with each other.
  • Ranked prioritiesWhat to fix first, second and third, with the expected impact of each.

Office

Fl No 102, Shree Villa, Lane No 4,
Laxmi Nagar, Kondhwa Budruk,
Pune 411048, India

Markets served

India, United States, United Kingdom, UAE

Entity

Essor Partners LLP

Fastest route: LinkedIn

There is no booking link and no gatekeeper. Message Omkar on LinkedIn with your brand and what is not working, and you will get a real answer, usually the same day.

Message Omkar on LinkedIn

Prefer email? omkar@essorpartnersllp.com

Or send the details here

Typically returned within five working days. No cost, no obligation.

Draft form, not yet wired to a backend. Final version will submit into GoHighLevel.

Get a free auditSee proof